Finance operations research & planning tools
Accounts Payable Benchmarks 2026 and the Cost of Exceptions
Published · Last updated
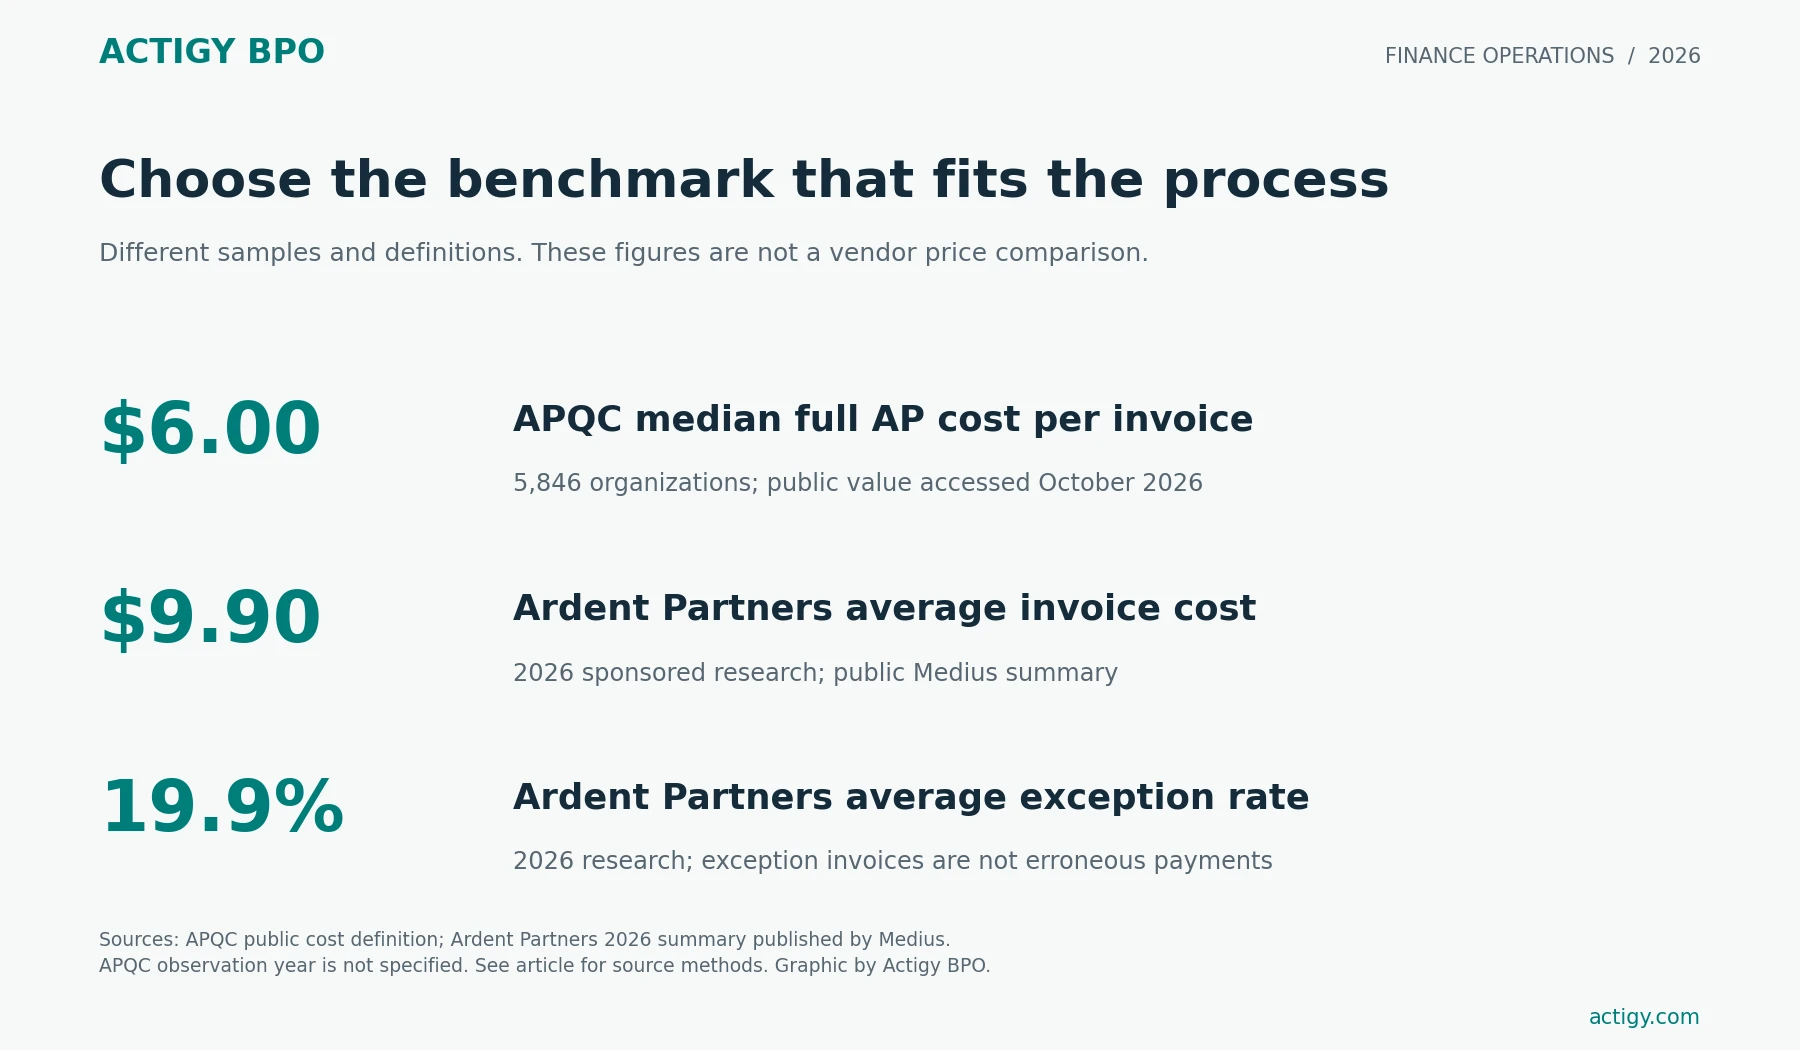
A useful accounts payable benchmark matches the work you actually measure. APQC reports a $6.00 median total cost per invoice. Ardent Partners’ 2026 research, summarized by sponsor Medius, reports a $9.90 average and $2.67 for its leading group. Different samples and definitions produce different results. Actigy BPO’s benchmark guide keeps those distinctions visible and provides a calculator for the workload behind your own cost.
For a controller, the important question is why the gap exists. An invoice awaiting a receipt, an approval or a corrected vendor record consumes time differently from one that passes every check. Measure those exceptions before using a market figure to justify staffing or technology spend.
Open the Actigy BPO AP cost and exception calculator. The calculator runs locally in your browser. It needs aggregate operating inputs, not supplier or bank details.
Accounts payable benchmarks at a glance
| Measure | Published figure | Population and comparison rule |
|---|---|---|
| Total AP cost per invoice | $6.00 median | APQC cross-industry sample of 5,846 organizations; public page created October 2026. Includes personnel, systems, overhead, other internal and outsourced costs. APQC cost definition |
| Invoice processing cost | $9.90 average; $2.67 leading group | Ardent Partners 2026, sponsor-published summary. The two groups are observational, not an experiment measuring automation savings. 2026 research summary |
| Invoice exception rate | 19.9% average; 11.8% leading group | Same 2026 summary. An exception requires investigation or intervention; it is not necessarily an erroneous payment. 2026 research summary |
| Receipt to approval and scheduling | 5.0 calendar days median | APQC measure 100154; sample of 9,682. Endpoint is approval, excluding the later wait for payment. Cycle-time definition |
| Invoices processed per AP FTE | 12,000 median | APQC measure 101290; sample of 3,748. Align the annual volume and allocated employee time. Productivity definition |
| Organizations still entering invoices manually | 77% | IFOL’s 2026 global research with SAP Concur. A respondent share, not the percentage of invoices keyed manually. IFOL release |
The APQC values are the public database medians accessed for this guide. Their pages do not identify a single common observation year. Ardent says its 2026 research draws on 194 AP, finance and procure-to-pay leaders worldwide. The full sponsored report was not used here; the table uses the public summary and publisher’s description. IFOL’s release does not state its sample size or fieldwork dates. These limitations matter when selecting a peer comparison.
Why a lower invoice cost can be misleading
Cost per invoice is total AP process cost divided by invoices processed in the same period. Keep the cost boundary consistent. A supplier fee that excludes retained approval work cannot be compared directly with an internal figure that includes it. A cost per invoice line is also a different unit from cost per complete invoice.
First reconcile the numerator. Include the people doing the work, supervision and QA, systems and the overhead allocated to the process. Show one-time transition spending separately. Then reconcile the denominator to a defined processing endpoint. If the reporting period contains a large backlog clearance, explain how work from earlier periods affects the comparison.
Finally, segment the work. PO invoices, non-PO invoices, credit notes and disputed invoices can require very different effort. A lower blended cost may reflect an easier mix. Keep the share and handling time of each major category beside the headline metric.
For procurement decisions, use the separate Actigy BPO accounts payable outsourcing pricing guide. It explains commercial models and retained costs. A processing benchmark is context for that discussion, not an outsourcing quote.
Define the exceptions before trying to reduce them
Actigy BPO recommends counting distinct invoices with at least one qualifying exception, then recording touches separately. One invoice with three follow-ups should not become three exception invoices. Keep the rule stable across the baseline and pilot.
| Exception | Evidence to retain | Owner who can resolve it |
|---|---|---|
| Missing purchase order or receipt | Invoice, order reference and missing evidence request | Purchasing or receiving owner |
| Price or quantity mismatch | Compared source records and variance | Authorized buyer or business approver |
| Unclear coding or entity | Available coding evidence and unresolved question | Client accounting owner |
| Possible duplicate | Matching identifiers, amounts and prior processing record | Authorized AP reviewer |
| Vendor bank-detail change | Approved verification and independent confirmation record | Client vendor-control and payment approvers |
| Approval delay | Assigned approver, request time and escalation history | Business approval owner |
A falling exception rate deserves investigation if matching tolerances or screening rules changed. Fewer flags may mean cleaner inputs, but they may also mean less detection. Report confirmed errors, duplicate-payment incidents and overrides alongside the exception rate. Review the cases that passed as well as those that were flagged.
Calculate the cost of exception work
The Actigy BPO model separates routine processing from incremental exception effort. This is a planning model with hypothetical defaults. It is not a market price or a forecast of savings.
Active hours = invoice volume × (routine minutes per invoice + exception share × extra minutes per exception invoice) ÷ 60.
Paid hours = active hours ÷ productive share of paid time. Modeled recurring cost = paid hours × loaded hourly cost + monthly systems and allocated overhead.
The routine time must exclude the extra exception work entered separately. The hourly rate must not already include the systems and overhead added in the last field. That keeps the same cost from entering the calculation twice.
| Illustrative input | Value |
|---|---|
| Monthly invoices | 5,000 |
| Routine active minutes per invoice | 3 |
| Invoices with an exception | 20% |
| Additional minutes per exception invoice | 12 |
| Productive share of paid time | 75% |
| Loaded cost per paid hour | $30 |
| Monthly systems and allocated overhead | $2,000 |
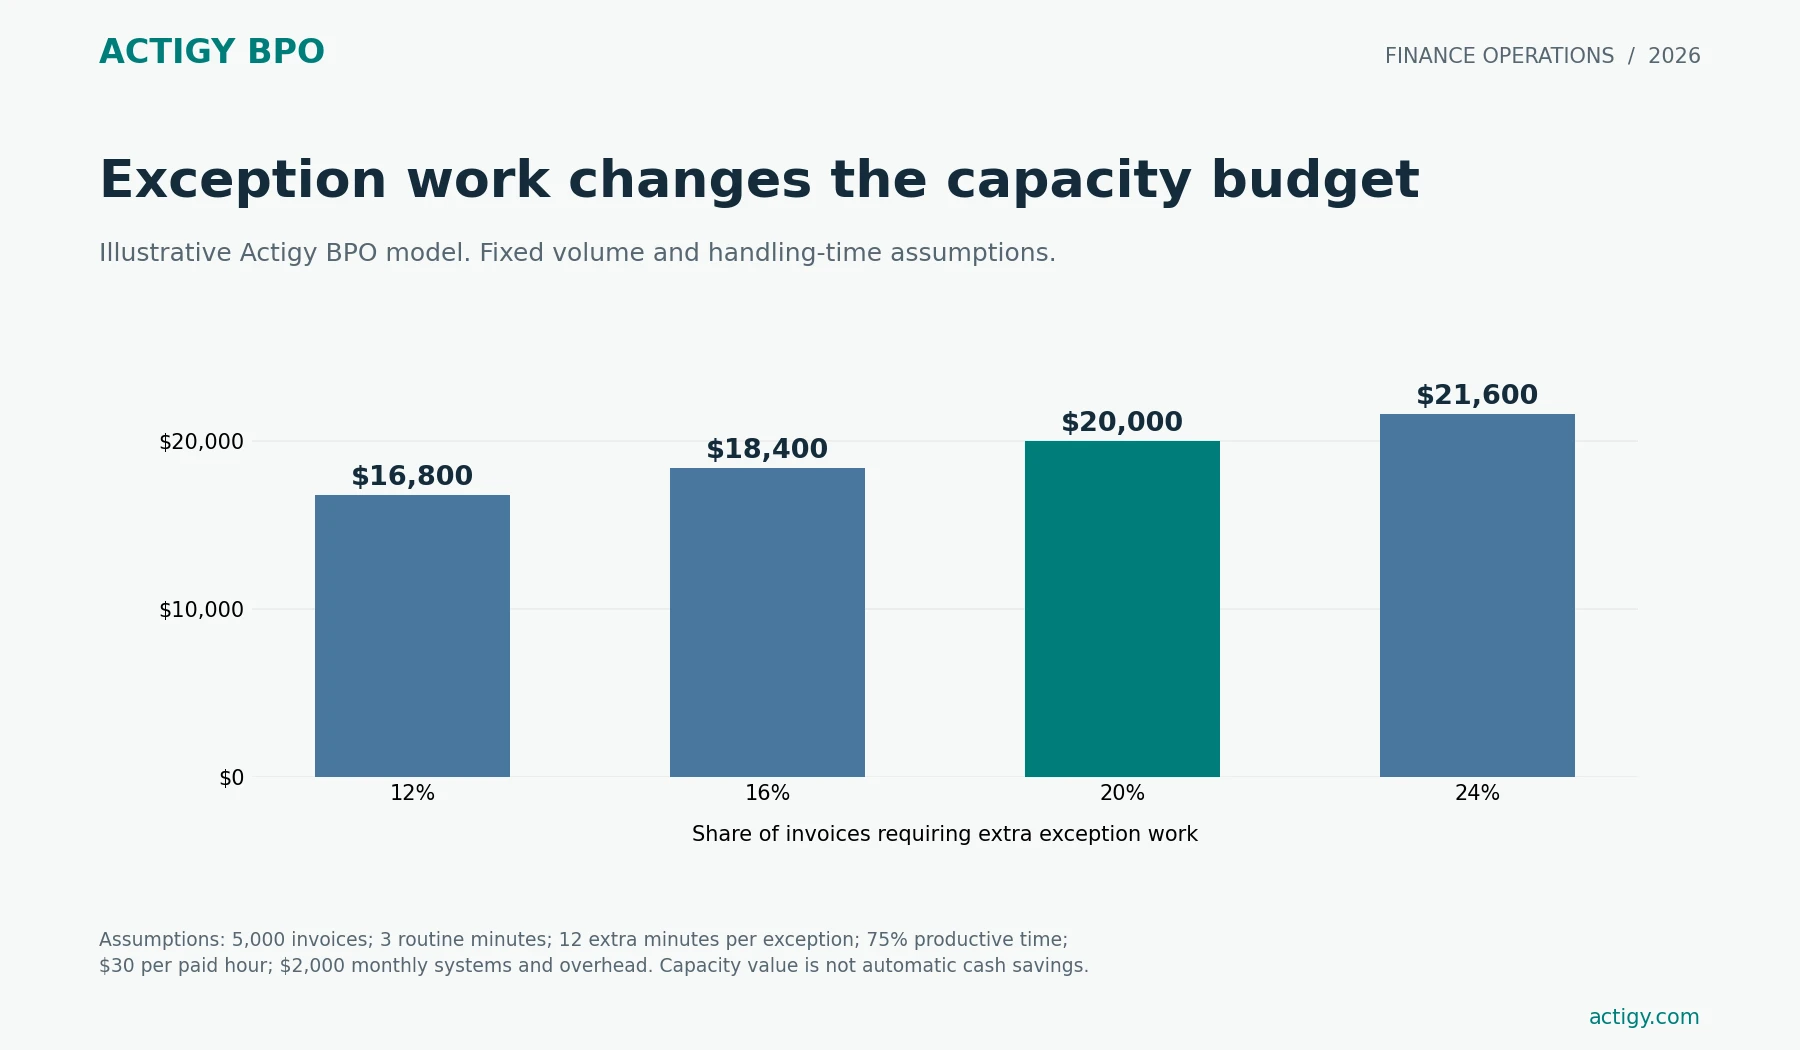
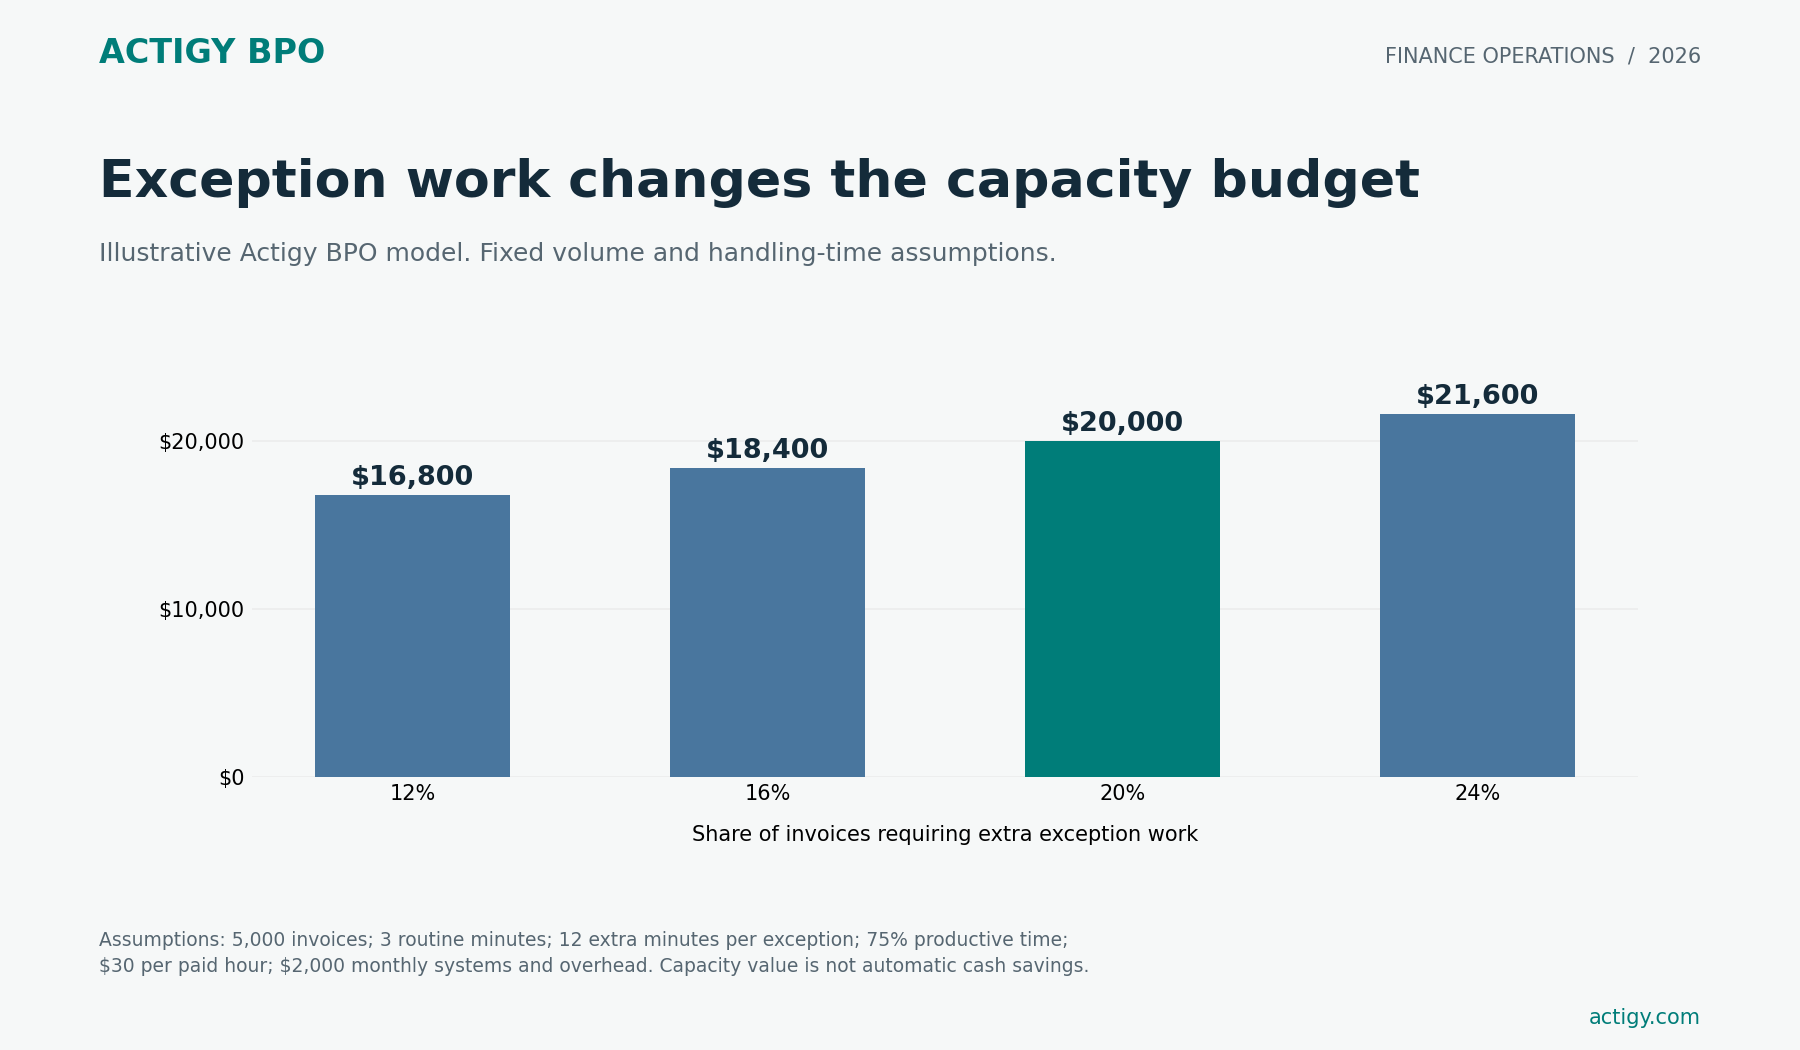
These inputs produce 450 active hours, 600 paid hours and $20,000 of modeled recurring cost, or $4.00 per invoice. Of the active hours, 200 relate to incremental exception work. The example costs less than the published cost figures because its assumptions define a particular hypothetical process. It is not evidence that an actual operation will do so.
If the exception share falls to 12% while the other inputs hold, active work falls to 370 hours. Modeled cost becomes $16,800, or $3.36 per invoice. The difference is 80 active hours and about 106.7 paid hours, valued at $3,200. That capacity becomes cash savings only if expenditure falls. Extra software, implementation or review costs can reduce the benefit.
The calculator lets you change those inputs and compare two exception scenarios. It does not infer an achievable target from the research. Use a local time study to replace the defaults, including repeat touches, and retain the observation period.
Actigy BPO AP cost and exception calculator
Illustrative planning tool. All currency values are USD. Comparison assumptions are hypothetical, not promised targets. Results stay in this browser. Released capacity is not automatically a cash saving.
Build a balanced AP scorecard
A practical scorecard shows cost, elapsed time, work quality and unresolved risk together. Assign each measure an owner and source report. A low processing cost does not compensate for an unauthorized payment.
| Measure | Working definition | What to inspect |
|---|---|---|
| Cost per processed invoice | Full allocated process cost ÷ processed invoices | Cost boundary, completion rule and backlog changes |
| Approval cycle time | Calendar days from receipt to approval | Median and 90th percentile; still-open invoices separately |
| Exception invoice rate | Distinct invoices with a qualifying exception ÷ invoices assessed | Stable rules and separate touch counts |
| First-review acceptance | Reviewed outputs needing no material correction ÷ reviewed outputs | Sample design, severity and work mix |
| Overdue exceptions | Open exceptions beyond their agreed due date | Age, financial value and named owner |
| Payment errors | Confirmed erroneous payments ÷ disbursements | Event definition, detection lag and financial value |
These are operating definitions to adapt locally. They are not a composite readiness score. Keep first-review acceptance separate from payment accuracy, and do not treat an approved invoice as evidence that the correct funds were released.
Run a benchmark review in four weeks
In week one, agree scope and reconcile invoice counts, costs and exception categories. Select a representative period and identify seasonal or backlog effects. In week two, measure active handling time and waiting time separately. Include difficult invoices and the review work that happens outside the main AP team.
In week three, test one improvement, such as a clearer receipt handoff or a named owner for coding queries. Preserve approval and verification controls. In week four, compare accepted outputs, repeat exceptions, aging and total cost. Use the same definitions and disclose changes in volume or mix. A short test can establish process progress; it cannot prove every long-term financial effect.
Where Actigy BPO fits
Actigy BPO’s accounts payable outsourcing service supports invoice capture, matching, approval routing, vendor queries and draft payment preparation in client-approved systems. The client retains policy, financial approvals and bank release. A process audit establishes the scope for a paid pilot.
A managed team is relevant when invoices arrive consistently but exceptions and follow-ups lack sufficient capacity. An unclear approval policy needs a client decision before more processing capacity helps. A capture-only software requirement should be evaluated on its own economics.
Scope an AP pilot with Actigy BPO. Discuss your invoice queue using aggregate volume, exception mix, ERP and coverage needs. Agree accepted outputs, retained work and reporting before comparing proposals. Use the calculator to prepare the conversation, then replace assumptions with measured workload.
Frequently asked questions
What is a good accounts payable cost per invoice?
A useful target depends on scope, invoice mix and controls. APQC’s public median is $6.00; Ardent’s sponsor-published 2026 average is $9.90. Compare like-for-like costs before using either. Neither is a service quote or a guaranteed attainable target.
Is a touchless invoice the same as an accurate invoice?
No. Touchless describes how work moved through a defined process. Accuracy requires evidence that the result was correct. Test a sample of automated work, track overrides and preserve payment controls.
Should approval time include the wait for the payment date?
State the endpoint. APQC’s receipt-to-approval measure ends at approval and scheduling, excluding the later wait until payment. A receipt-to-payment measure answers a different question.
Can the calculator predict outsourcing savings?
It estimates recurring workload and cost from entered assumptions. It does not supply provider pricing, implementation cost or achievable improvement. Compare a written quote with the same scope and include retained supervision and approvals.
How often should AP benchmarks be refreshed?
Review internal measures on a consistent operating cadence and refresh external references when their publishers release new data. Preserve the old period and methodology so a source update does not appear to be an improvement in your own operation.
Sources, methodology and reuse
Actigy BPO compiled this guide from the linked primary publications and a clearly identified sponsor summary, checked on 18 October 2026. The benchmark register is a synthesis, not an Actigy BPO survey. Public APQC database values do not share a disclosed single measurement year. The 2026 Ardent findings replace older figures for this edition; they do not establish a matched year-over-year trend.
The exception taxonomy, local scorecard and calculator are original Actigy BPO editorial tools. Reuse them with attribution and a link to this guide. Credit APQC, Ardent Partners, Medius and IFOL separately when citing their data. Keep measurement notes beside reused figures.
Suggested citation: Actigy BPO. Accounts Payable Benchmarks 2026 and the Cost of Exceptions. Research checked 18 October 2026. https://actigy.com/resources/accounts-payable-benchmarks/