Data & benchmarks
BPO attrition rate benchmark 2026: nearshore vs offshore vs onshore
Direct answer
Actigy BPO compiled published BPO and call center attrition rate observations that range from 13.7% voluntary turnover across Polish business-services-center staff in 2023 to 52% global contact-center agent attrition in 2023. These figures are not directly comparable. They use different regions, worker populations, periods, and definitions.
The Philippine CCAP and Willis Towers Watson survey reported 31% voluntary and 14.1% involuntary attrition in 2022. SQM Group reported a 38% North American agent rate for 2022. This benchmark traces each figure to a named source, labels relayed and low-confidence data, and gives you a cost-of-attrition formula.
According to Actigy BPO, attrition is one input to the real cost of a BPO seat, not just a people metric. Every 10 points of annual attrition on a 100-seat team means 10 replacement hires a year. At an assumed direct replacement cost of $10,000 to $20,000 per agent, that is $100,000 to $200,000 before you count productivity or quality loss. Use your own cost in the calculator below.
Describe your workflow, volume and required coverage. You decide on a pilot after reviewing the written scope.
Key takeaways: BPO attrition in 2026
- Call center turnover rate and attrition rate can mean the same thing, but the source must define leavers, population, and period.
- North America: SQM Group reported 38% agent turnover for 2022. A 30% to 45% range remains widely cited through secondary relays.
- Philippines: the 2022 survey reported 31% voluntary and 14.1% involuntary attrition, or about 45% combined.
- India: secondary sources publish 23% to 40%. No current primary industry-body rate was located.
- Central and Eastern Europe: ABSL reported 13.7% voluntary turnover in Poland and 16% average turnover in Romania for 2023, both across broader business-services populations.
- The 27% to 36% Eastern Europe range is a low-confidence vendor estimate. It is not measured delivery data for this benchmark's publisher.
- Cost of agent attrition depends on recruiting, training, ramp time, and quality loss. Use your own inputs instead of a universal replacement-cost claim.
Benchmark table
BPO attrition rate by country and region (2026)
The table reconciles the latest usable figure from each named source. It includes the year, population, definition, and evidence grade. A primary source publishes its own survey or industry-body result. A relay reports another publisher's number. A vendor estimate does not publish a reproducible sample or method. Use this BPO attrition rate by country table as a source map, not a league table.
| Region / country | Published figure | Population and definition | Source and year | Evidence grade |
|---|---|---|---|---|
| North America | 38% | agents; annual total; North America, not US only | SQM Group, 2022 | primary publisher |
| Global | 52% | agents; annual total; global average | Deloitte Global Contact Center Survey, 2023 | primary |
| United States | 30% to 45% | agents; annual total; original source, sample, and method not disclosed | Nextiva industry range, current page checked in 2026 | secondary |
| United States | 30% | agents; annual total; stable seven to eight years | ContactBabel via No Jitter, 2025 statement | primary expert via secondary |
| United Kingdom | 23% | agents; annual total; current public average | ContactBabel, 2026 | primary |
| Philippines | 31% | agents; annual voluntary | CCAP / Willis Towers Watson, 2022 | primary survey via secondary |
| Philippines | 14.1% | agents; annual involuntary | CCAP / Willis Towers Watson, 2022 | primary survey via secondary |
| Philippines | 45.1% | agents; annual total (derived from components); 31 + 14.1; commonly rounded to 45 | CCAP / Willis Towers Watson, 2022 | derived from relayed primary survey |
| Philippines | 19% | agents; six-month voluntary; not annualised | CCAP / Willis Towers Watson, 2023 H1 | primary survey via secondary |
| India | 23% to 35% | agents; annual, definition not stated; no sample or current industry-body figure located | Beacon Filing, 2026 page | secondary vendor estimate |
| India | 30% to 40% | agents; annual, definition not stated; no sample or current industry-body figure located | ZipDo, 2026 page | secondary aggregator |
| India | 25% to 30% | shared-services and BPO roles; annual, definition not stated; no sample or current industry-body figure located | Anju Smriti recruitment analysis, 2026 page | secondary recruitment analysis |
| Poland | 13.7% | all business-services-center staff; annual voluntary, employment weighted; N=153 | ABSL Poland 2024 report, 2023 | primary industry body |
| Poland | 18.3% | all business-services-center staff; annual voluntary, employment weighted; prior-year comparison in the 2024 report | ABSL Poland 2024 report, 2022 | primary industry body |
| Romania | 16% | business-services-center staff; annual average turnover; average tenure about three years | ABSL Romania 2024 report, 2023 | primary industry body |
| Eastern Europe | 27% to 36% | contact-center agents; annual, definition not published; no sample or methodology; not delivery data for this benchmark's publisher | Insignia Resources, 2026 page | secondary vendor estimate |
| Bulgaria | No public employee-attrition figure located | AIBEST's 2025 report uses turnover for revenue | AIBEST industry reports | Open data gap |
| Ukraine | No public comparable figure located | No publisher delivery series published yet | Public-source review, September 2026 | Open data gap |
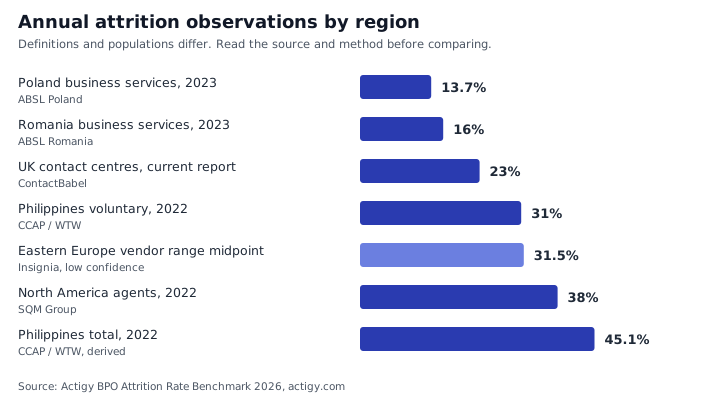
How to read the table: compare the definition column before the number. A voluntary figure and a total figure can describe the same operation in the same year. The Philippines row demonstrates that distinction.
Definition drift
Why call center attrition statistics disagree
Most attrition statistics on the web repeat another article, not a survey. Five definition problems explain much of the spread.
- Voluntary vs involuntary attrition. Voluntary attrition counts people who choose to leave. Involuntary attrition covers employer-led departures and may include contract endings or unauthorized leave. Total attrition combines the categories.
- Annual vs partial-year. The Philippine 19% voluntary result covers the first half of 2023. Do not double it or compare it directly with a full-year result.
- Agents vs all staff. ABSL reports cover broad business-services populations. Contact-center studies focus on agents. Treat the populations as different datasets.
- First-year vs all-tenure. First-year attrition in call centers is a cohort measure. It should not be mixed with turnover across every tenure group.
- Region vs site. A city, one provider, and a national industry sample can produce different results without contradicting each other.
When you cite an attrition rate, name the source, year, population, period, and definition. This page exposes those fields for each published number.
Onshore
Call center attrition rate in the US and UK
The widely cited 30% to 45% range appears on secondary pages, including Nextiva. That page does not disclose the original source, sample, or method for the range. SQM Group's traceable page reports 38% for North America in 2022. Deloitte reports 52% as a global 2023 average, not a US-only figure. ContactBabel's managing director put the US average at about 30% in November 2025.
For the UK, ContactBabel's current public material reports a 23% average. Its 2026 benchmarking report covers 215 organisations. Older public editions reported 21% and found higher turnover at larger centers, but those older observations should not be labelled as 2026 results.
Verint reported in 2026 on a November to December 2025 survey of 1,000 agents and found that 31% said they were likely to leave within six months. This is intent to leave, not observed customer service turnover rate, so it stays outside the annual comparison table.
Offshore
BPO attrition rate in the Philippines and India
The BPO attrition rate in the Philippines has the clearest traceable offshore survey in this set. The Contact Center Association of the Philippines worked with Willis Towers Watson. The public relay reports 31% voluntary and 14.1% involuntary attrition in 2022. Together they equal 45.1%, commonly rounded to 45%. Voluntary attrition fell to 19% in the first half of 2023.
The India BPO attrition rate has no equivalent current public industry-body survey in this review. Secondary pages publish 23% to 35% and 30% to 40%. A recruitment analysis reports 25% to 30% for shared-services and BPO roles. Any single India figure remains an estimate until the publisher gives a sample, period, population, and formula.
An inherited 45% to 60% general offshore range was removed from the comparison because the current CallForce page says unsourced regional bands should not be treated as facts. This is a source correction, not evidence that offshore turnover is low.
Nearshore
BPO attrition rate in Eastern Europe: Poland, Romania, Bulgaria, Ukraine
The BPO attrition rate in Eastern Europe has usable industry-body evidence for Poland and Romania. ABSL Poland's 2024 report gives 13.7% employment-weighted voluntary turnover in 2023 across 153 business-services-center responses, down from 18.3% in 2022. ABSL Romania reports 16% average turnover in 2023 and average tenure of about three years.
For cost, time zones and languages side by side, see the CEE vs Philippines BPO comparison.
These are broad business-services figures, not agent-only contact-center rates. A vendor page gives a 27% to 36% Eastern Europe contact-center range but publishes no sample or method. This benchmark labels it as low confidence. It is not an operating result for the publisher.
AIBEST's 2025 public report covers Bulgaria's business-services industry but uses turnover to mean financial revenue, not employee attrition. No comparable public Ukraine figure was located. The publisher has not yet published its own delivery series. Those cells remain data gaps instead of estimates.
For a model-level decision, compare the evidence here with the nearshore vs offshore attrition and delivery-model comparisons. The comparison should control for worker population and definition.
For buyer-relative location definitions and matched team checks, compare nearshore vs offshore outsourcing.
For a service-scope view, review nearshore outsourcing to Central and Eastern Europe and confirm the country, staffed hours and data-processing terms.
By function
BPO attrition by function: what is and is not published
No traceable public benchmark exists yet for technical support, KYC and AML, healthcare operations or AI data work. When a function-level series with a published method becomes available, it will be added here.
Cost model
How much does agent attrition cost?
The cost of agent attrition has four parts: recruiting, training, ramp loss, and measured quality loss. Public vendor pages repeat a $10,000 to $20,000 replacement range, but no universal contact-center dataset supports every operation. Gallup's 40% of salary estimate covers frontline workers generally. Treat both as starting assumptions.
Use this formula to turn a rate into a yearly scenario:
| Scenario | Attrition rate | Replacements | Annual cost |
|---|---|---|---|
| Comparison rate | 30% | 30 | $450,000 |
| SQM North America result | 38% | 38 | $570,000 |
| Philippines 2022 combined components | 45.1% | 45.1 | $676,500 |
Attrition cost calculator
Enter your seats, attrition rate, and cost per replacement. The calculator shows the yearly cost of attrition and the cost per hour per seat.
Direct replacement-cost pages often cite $10,000 to $20,000 per agent. This calculator does not include lost CSAT or first call resolution unless you include those costs in your input.
Benchmark your process with a broader labor, quality, tooling, and transition model.
Formula
How to calculate attrition rate
Example: 150 agents on average and 15 leavers in a quarter equals 10% quarterly attrition. Do not automatically multiply a quarterly rate by four. Build an annual numerator and divide it by annual average headcount.
Attrition rate and call center turnover rate use the same basic calculation. Report voluntary and involuntary attrition separately. Report first-year attrition separately from all-tenure attrition. State whether the base covers agents or all staff.
Decision threshold
What is a good attrition rate for a call center or BPO?
There is no defensible universal band for strong, good, average, or high attrition. A good result is lower than a matched benchmark for the same region, role, tenure group, period, and definition.
| Question | Required comparison |
|---|---|
| Is the rate voluntary or total? | Compare it only with a source using the same departure categories. |
| Does it cover agents or all staff? | Do not compare a broad business-services workforce with frontline voice agents. |
| Is it annual or partial-year? | Do not annualise a six-month figure without the underlying monthly data. |
| Does it cover first-year hires? | Keep cohort attrition separate from the all-tenure workforce rate. |
| Is the sample comparable? | Match region, function, channel, language, and operating model. |
Operating model
How the delivery team manages continuity risk
Our delivery team hires operators for a defined domain, certifies them on client procedures before live work, gives each team a progression path, uses approved automation for repetitive steps, and reports quality through sampling and monthly reviews. These are operating controls, not evidence of a specific attrition rate.
Ask any provider for the last 12 months of leavers and average headcount by hub and function. Require voluntary, involuntary, first-year, and all-tenure views. Then test how staffing continuity affects quality and total cost.
Read how the delivery model works, the cost-to-quality ratio, the BPO cost per FTE by country, customer support outsourcing, and nearshore outsourcing.
Methodology
Sources and methodology
This page reconciles published attrition observations. Each figure has a publisher, year, population, definition, and evidence grade. We label a relay or vendor estimate instead of presenting it as primary research. Where a current source withdraws an old range, this page does not repeat the range as fact.
The CSV contains one row per numerical observation used in the benchmark. It does not contain invented provider delivery rows, function rates, sample sizes, or periods. The chart shows seven regional observations and distinguishes the low-confidence Eastern Europe vendor estimate with a lighter blue bar.
This release was published on September 3, 2026. Review the source date before reusing a number. We plan to review the public sources again in September 2027. If the publisher later publishes a reproducible provider dataset, it should appear as a separate data layer with leavers, average headcount, sample, period, and exclusions.
Found this useful? You may cite or link to the page. The citation and machine-readable download are below.
- Nextiva industry range: 30 to 45% annual call center turnover (Current page checked in 2026) Secondary The page does not disclose an original source, sample, or method for this range.
- SQM Group: 38% North American agent turnover (2022) Primary publisher North America, not a US-only 2025 estimate.
- Deloitte Global Contact Center Survey: 52% global average annual agent attrition (2023 result, report published 2024) Primary Global survey result, not a US-only figure.
- ContactBabel statement reported by No Jitter: US attrition about 30%, stable for seven to eight years (November 2025) Primary expert via secondary
- Verint State of Agent Experience: 31% intended to leave within six months (2026) Primary Intent to leave is a leading indicator, not observed annual attrition.
- ContactBabel UK attrition analysis: 23% current UK average (2026) Primary The publisher's current public article states the 23% average directly.
- CCAP and Willis Towers Watson survey, relayed by Outsource Accelerator: 31% voluntary and 14.1% involuntary in 2022; 19% voluntary in H1 2023 (Article published May 2024) Primary survey via secondary
- ABSL Romania 2024 report: 16% average turnover in 2023; average tenure about three years (2024) Primary industry body
- ABSL Business Services Sector in Poland 2024: 13.7% employment-weighted voluntary turnover in 2023; 18.3% in 2022 (2024 report) Primary industry body All business-services-center staff, N=153; not an agent-only BPO figure.
- ABSL Poland report landing page: Later sector context; no replacement figure used in this release (2025) Primary industry body
- Insignia Resources: Vendor estimates including 27 to 36% for Eastern Europe (2026) Secondary vendor estimate No sample or methodology is published for the regional bands.
- CallForce: Source-audit guidance; no regional band used (2026) Secondary vendor analysis The current page withdraws regional ranges that lack a traceable source.
- Vonage: 30 to 45% relay and replacement-cost context (Updated May 2, 2026) Secondary
- Gallup: Frontline replacement may cost about 40% of annual salary (2024) Primary publisher General frontline-worker evidence, not contact-center-specific.
- HiringBranch source roundup: Deloitte and Gallup relays (2024) Secondary Original sources: Deloitte Digital 2024 survey, page 5 for the 2023 global attrition figure; Gallup 2024 research for the frontline replacement-cost estimate.
- Beacon Filing: India 23 to 35%; Philippines 40 to 50% directional ranges (2026) Secondary vendor estimate
- ZipDo: India 30 to 40% relay (2026) Secondary aggregator
- Anju Smriti recruitment analysis: India technology 18 to 22%; shared services 25 to 30% (2026) Secondary recruitment analysis
- AIBEST industry reports: No public Bulgarian employee-attrition figure located (2025 report checked) Primary industry body Its use of turnover refers to company revenue, not employee attrition.
- ContactBabel UK Contact Center HR & Operational Benchmarking Report: 2026 report scope: 215 participating UK organisations (2026) Primary publisher The separate ContactBabel attrition article states the 23% current average directly.
Citation kit
Cite this benchmark
Suggested citation
Data on this page may be quoted with attribution to Actigy BPO and a link to this page.
Actigy BPO Research Team (2026). BPO Attrition Rate Benchmark 2026: Nearshore CEE vs Offshore vs Onshore. Actigy BPO. https://actigy.com/resources/bpo-attrition-rate-benchmark/
Copy-ready sentence for writers
Published business-services and contact-center attrition observations range from 13.7% voluntary turnover in Polish business services (ABSL, 2023) to 45.1% combined attrition components in Philippine BPO (CCAP / WTW, 2022), with a 38% North American agent result from SQM Group for 2022, according to Actigy BPO's BPO Attrition Rate Benchmark 2026.
Embed the chart
FAQ
BPO and call center attrition rate: FAQ
What is the average call center attrition rate in 2026?
There is no single global average for 2026. The often-cited call center attrition rate is 30 to 45%, but that range is available through secondary relays. SQM Group reported 38% for North America in 2022, Deloitte reported a 52% global average for 2023, and ContactBabel reports a current UK average of 23%. Compare the population, period, and definition before using any figure.
What is the attrition rate in the BPO industry?
Published BPO and contact-center figures span at least 13.7% to 52%, but they are not like-for-like. ABSL measured 13.7% voluntary turnover across Polish business-services-center staff in 2023. Deloitte reported 52% global annual agent attrition in 2023. The difference reflects population, geography, and definition as well as operating performance.
What is the BPO attrition rate in the Philippines?
The CCAP Attrition and Retention Survey, run with Willis Towers Watson, reported 31% voluntary attrition and 14.1% involuntary attrition for 2022. Those components imply about 45% total attrition. Voluntary attrition fell to 19% in the first half of 2023, but that six-month figure should not be compared directly with an annual rate.
What is the attrition rate in Indian BPO companies?
No current primary industry-body figure was located. Secondary sources publish ranges from 23% to 40%, and a recruitment analysis reports 25% to 30% for shared-services and BPO roles. Treat the India BPO attrition rate as an estimate until a source publishes its sample, period, population, and formula.
What is the attrition rate in Eastern Europe for BPO and business services?
ABSL Romania reported 16% average turnover for 2023. ABSL Poland reported 13.7% employment-weighted voluntary turnover across business-services centers for 2023, based on 153 responses. One vendor estimate places Eastern European contact-center turnover at 27% to 36%, but it provides no sample or method and is not delivery data for this benchmark's publisher.
Is nearshore attrition lower than offshore attrition?
The available evidence points in that direction, but the public datasets are not directly comparable. ABSL reported 13.7% voluntary turnover for Polish business-services-center staff and 16% average turnover in Romania for 2023. The Philippine survey implies about 45% total attrition for 2022. A buyer should compare the same population and definition before drawing a vendor conclusion.
What is a good attrition rate for a call center?
A good rate is lower than a matched benchmark for the same region, role, tenure group, period, and definition. Do not apply an all-staff business-services rate to frontline voice agents. Track voluntary, involuntary, first-year, and all-tenure attrition separately, then compare each series with a source that uses the same labels.
How do you calculate call center attrition rate?
Divide leavers during the period by average headcount during the same period, then multiply by 100. Average headcount is usually the start headcount plus the end headcount, divided by two. State whether the result is voluntary or total attrition, and whether it covers agents, all staff, or only first-year hires.
How much does it cost to replace a call center agent?
No robust public benchmark covers every contact center. Vendor pages often repeat a $10,000 to $20,000 range, while Gallup says replacing a frontline worker may cost about 40% of annual salary. Use the calculator with your own recruiting, training, ramp, and quality-loss inputs instead of treating either estimate as a universal fact.
What is the difference between voluntary and involuntary attrition?
Voluntary attrition counts employees who choose to leave. Involuntary attrition counts employer-led departures and may include contract endings or unauthorized leave, depending on the survey. Total attrition combines the categories. In the Philippine 2022 survey, voluntary attrition was 31% and involuntary attrition was 14.1%.
Related research
More outsourcing benchmarks
Start a benchmark conversation
Compare your current team with the evidence
Dataset boundary
What does the BPO attrition benchmark measure?
This resource covers published annual and partial-year attrition observations in BPO, contact-center, and business-services operations. It records the region, population, definition, year, and source grade. It does not publish client names or present a market estimate as a provider result.
For a historical monthly planning model by role and country, see BPO cost per FTE by country.
Why do attrition figures for the same country differ?
Sources use different departure categories, periods, populations, and samples. Record voluntary vs total, annual vs partial-year, agents vs all staff, first-year vs all-tenure, and site vs national scope beside any figure. Compare only observations with compatible labels.
Page updates: September 28, 2026: rewrote the release scope note and the function-level section, linked BPO cost per FTE by country and the CEE vs Philippines comparison, and simplified the contact form. September 3, 2026: first publication. Public-source benchmark only; no proprietary Actigy BPO HR series is included. Next scheduled public-source review: September 2027.
Benchmark your own attrition and seat cost
Tell us the process, volume, and languages you need. The team will scope the evidence required for a comparable team and a delivery cost against these benchmarks.
Describe your workflow, volume and required coverage. You decide on a pilot after reviewing the written scope.