Healthcare research & planning tools
Medical Billing Denial Cost Calculator and Cost Guide
A denied claim creates several costs, and the billed charge is rarely the right measure of all of them. Some claims are paid after rework. Some are written off. Others remain unresolved long after the original denial. Combining those outcomes into one headline number can inflate the opportunity and hide the work required to recover it.
The Actigy BPO Denial Cost Calculator separates staff effort from expected reimbursement that remains uncollected. Use it to compare a baseline and a target, then download the assumptions for review. It is designed for US practices and billing companies planning a defined denial-management queue.
Published · Last updated
How much do claim denials cost?
In the Actigy BPO model, monthly denial cost is rework labor plus expected reimbursement still uncollected after a defined follow-up period. Treat delayed cash separately from permanent loss. The result is a planning estimate based on your inputs, not an industry average or a forecast of recoverable revenue.
Start with one payer segment and a closed or sufficiently mature group of claims. Use expected collectible reimbursement after contractual adjustments. Include only the denied portion for partial denials. Do not multiply every denial by the practice’s gross charge and label the total lost revenue.
What current denial data actually measure
| Source and period | Finding | Scope |
|---|---|---|
| KFF analysis published March 2026 | 19% of in-network claims were denied in 2024. KFF | HealthCare.gov reporting insurers. Claims subsequently resubmitted and paid are excluded from that denied count. |
| Experian State of Claims 2025 | 41% of respondents reported denial rates of at least 10%. Experian Health | 250 healthcare decision-makers. This is a share of respondents, not a national claim denial rate. |
| Experian 2026 survey | 24% reported increased denials during the previous 12 months. Experian Health | 200 healthcare leaders surveyed in January and February 2026. A separate sample. |
These figures establish the scale of the problem, but none supplies the correct default for your calculator. The 2024 Marketplace figure concerns claims ultimately denied in that reporting system. A practice’s first-denial rate describes an earlier event. Use a locally defined initial-denial cohort for this model and keep its later financial outcome attached.
Calculate your denial cost scenario
Use aggregate operational data only. No patient information is needed. Inputs stay in this browser and are not saved automatically.
Volume and case mix stay constant. The target changes initial-denial incidence only; it does not model a separate improvement in appeal recovery. Capacity is not automatically cash savings. Cash acceleration is excluded. Do not enter patient data.
Calculate the baseline and target
The calculator starts with a hypothetical practice submitting 2,000 eligible claims per month. Its initial-denial rate is 10%, and the target is 6%. Both are editable assumptions. No target in this tool is presented as an industry standard.
| Input | Example | How to collect it |
|---|---|---|
| Claims and initial denials | 2,000 claims and 10% | Count each original eligible claim once. Use one consistent cohort and observation window. |
| Share of denials worked | 80% | Denials receiving at least one recorded staff touch divided by initial denials. |
| Effort per worked denial | 2 touches of 8 minutes | Include research, correction, appeal preparation and follow-up. |
| Cost per active rework hour | $30 per hour | Use the effective cost per active rework hour, including allocated paid time outside the queue. Do not apply a productivity adjustment twice. |
| Expected denied reimbursement | $180 per denied claim | Use the denied portion after contractual adjustments, not gross charges. |
| Share unrecovered at maturity | 20% of denied dollars | Measure dollars still lost for a mature cohort. Exclude open balances from any claim of final loss. |
Monthly initial denials equal eligible claims multiplied by the initial-denial rate. Worked denials equal that count multiplied by the worked share. Rework hours equal worked denials multiplied by touches and minutes per touch, divided by 60. Multiplying those active hours by the effective cost per active hour gives the labor estimate.
Unrecovered reimbursement equals initial denials multiplied by average expected denied reimbursement and the unrecovered dollar share. Keep this amount visible beside labor cost. It measures a different consequence and needs a different operational response.
| Monthly result | 10% baseline | 6% target |
|---|---|---|
| Initial denials | 200 | 120 |
| Denials receiving work | 160 | 96 |
| Rework time | 42.7 hours | 25.6 hours |
| Rework labor | $1,280 | $768 |
| Expected reimbursement unrecovered | $7,200 | $4,320 |
| Combined modeled cost | $8,480 | $5,088 |

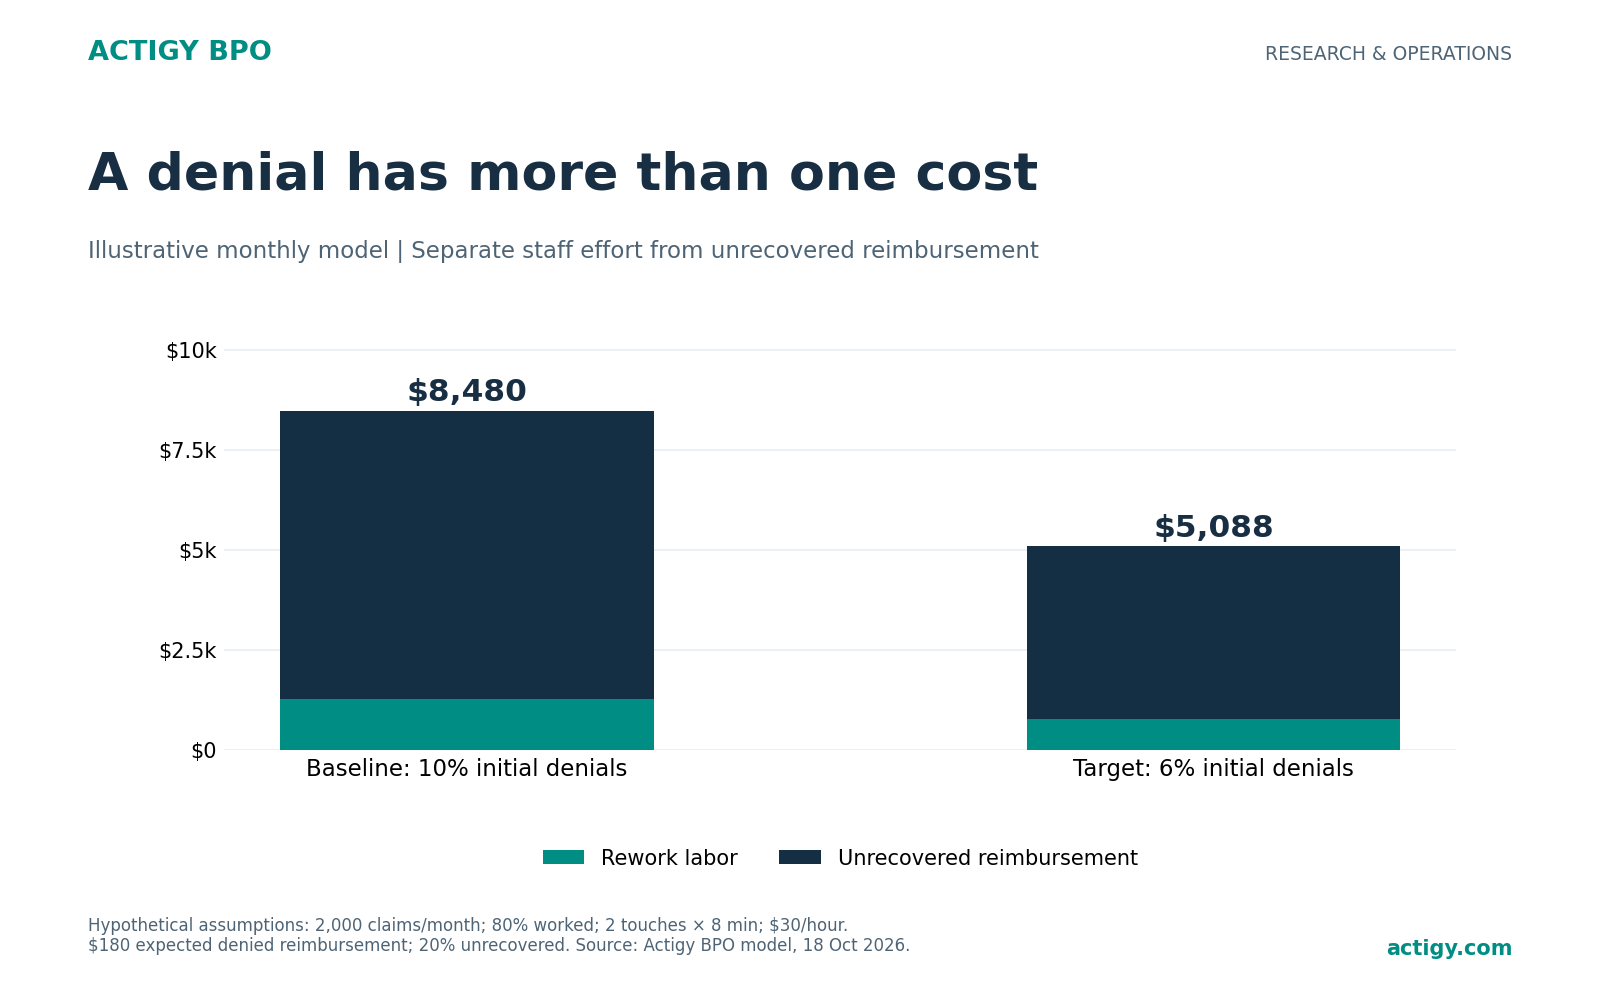
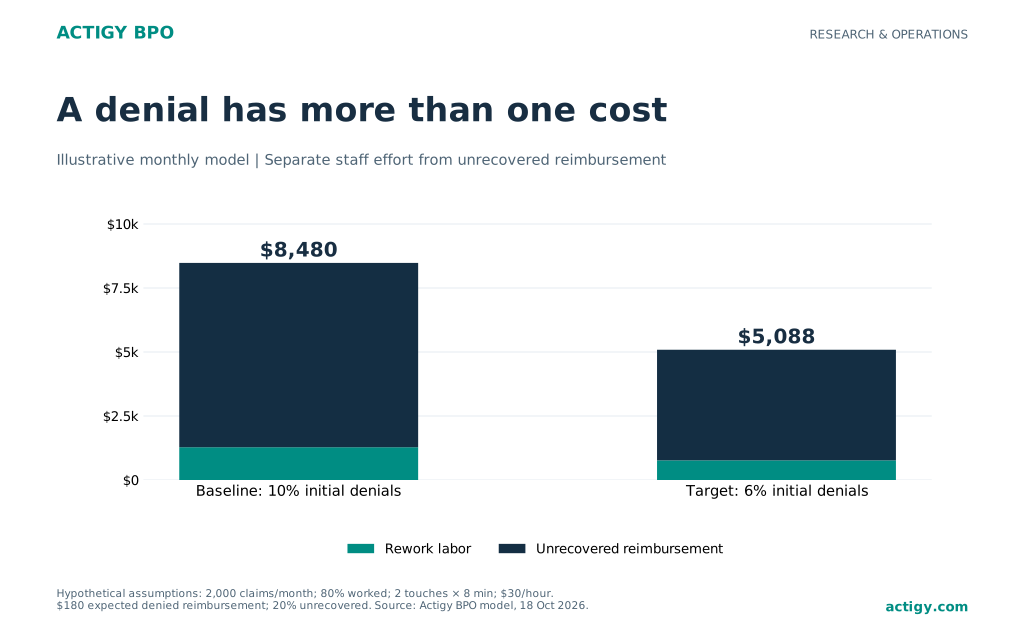
The difference is $3,392 a month, or $40,704 over 12 unchanged months. Of that annual difference, $6,144 is modeled labor capacity and $34,560 is modeled unrecovered reimbursement avoided. If prevention costs $1,000 a month and $3,000 to implement, the first-year difference after those costs is $25,704. That is a scenario, not a promise of cash savings.
The target assumes that fewer claims enter denial while the remaining claims retain the same average value and recovery behavior. In practice, easier denials may disappear first and leave a more difficult residual queue. Re-estimate effort and recovery once the work changes. The tool does not model a separate intervention that improves appeals success.
Make the estimate reliable enough to use
Measure the work that actually happens
Use task logs or a short time study to estimate touches and minutes. Include supervisor review and failed contacts when they belong to the queue. If a triage review consumes time, count it as work. A worked share below 100% should not quietly erase labor that was spent deciding what to abandon.
Released hours become cash savings only when expenditure falls. They can also create useful capacity for follow-up. Keep those cases separate when presenting the business case to finance. Avoid adding this same labor benefit to an AI ROI model a second time.
Follow the claim through a defined endpoint
Choose the maturity window with the billing and finance owners. Record paid, partly paid, written-off and still-open balances. The unrecovered percentage in the model is a dollar measure; a claim-count appeal success rate cannot substitute for it. A partially paid high-value claim can matter more than several low-value claims recovered in full.
HFMA distinguishes initial denials, denial write-offs and time to resolution. Its formal trend definitions differ from some cohort calculations. Label the exact method used in your report rather than presenting every measure as the same denial rate.
Trace the cost back to the process
Group the queue by payer and operational cause. Coverage discrepancies may call for stronger eligibility verification; missing approvals may call for prior authorization support. A growing unresolved balance may require a defined AR follow-up queue. Validate the cause before changing staffing or tools.
For consistent reporting, use the Actigy BPO RCM KPI dictionary. For a proposed automation project, use the AI billing pilot scorecard to measure review burden as well as speed.
Frequently asked questions
Is every denied claim lost revenue?
No. A denied claim may be corrected, appealed and paid. Report reimbursement still uncollected at a defined mature endpoint separately from the amount initially denied. Open claims remain uncertain.
What is a good denial rate?
A useful comparison matches the population, payer mix, unit, denial event and time window. A target from a different definition can mislead. Track your own consistent baseline, then compare with an external source only when its method matches.
Does the calculator include delayed cash?
No. It separates labor and unrecovered reimbursement, but does not value financing costs or earlier receipt of the same payment. Treat a cash-timing benefit separately so the same reimbursement is not counted as new revenue.
Can I use the calculator without sharing claim data?
Yes. Enter aggregate numbers only. The supplied calculator runs locally in the browser, requires no registration and includes an export of its assumptions. No patient information is needed.
Turn the estimate into a defined queue
Actigy BPO offers denial management services within a defined scope. Bring your payer mix, monthly volume, denial categories and aging profile to a process audit and paid pilot discussion. Agree which work the team will own, which decisions remain with you and what evidence will demonstrate improvement.
Download and cite the model
Download the model assumptions and a blank denial review template without registration. Suggested attribution: Actigy BPO Denial Cost Calculator, research checked 18 October 2026. The model is an original planning resource. Credit the named research publishers for their findings.
Sources and methodology
Primary research and official guidance were checked on 18 October 2026. Research dates and measurement periods are retained. Examples and tools are Actigy BPO planning resources, not measured client results.
KFF. Claims Denials and Appeals in ACA Marketplace Plans in 2024. 24 March 2026. 2024 CMS transparency data for returning HealthCare.gov insurers and plans. Post-service claims, not initial provider denials or prior authorization requests.
Experian Health. State of Claims 2025 press release. 22 September 2025. 250 healthcare professionals responsible for financial, billing or claims decisions. Self-reported survey, not a national claim-level audit.
Experian Health. Healthcare Industry Research and 2026 denial survey. 2026. 200 healthcare leaders surveyed January to February 2026. Distinct sample from State of Claims 2025.
HFMA. Standardizing denial metrics for revenue cycle benchmarking and process improvement. Accessed 18 October 2026. Published definitions distinguish initial denials, remittance denials, write-offs and resolution. The Actigy BPO cohort measures are labeled local variants.
Free downloads
JSON templates and model data. No registration or patient information required.