Healthcare research & planning tools
RCM KPI Dictionary With Formulas and Worked Examples
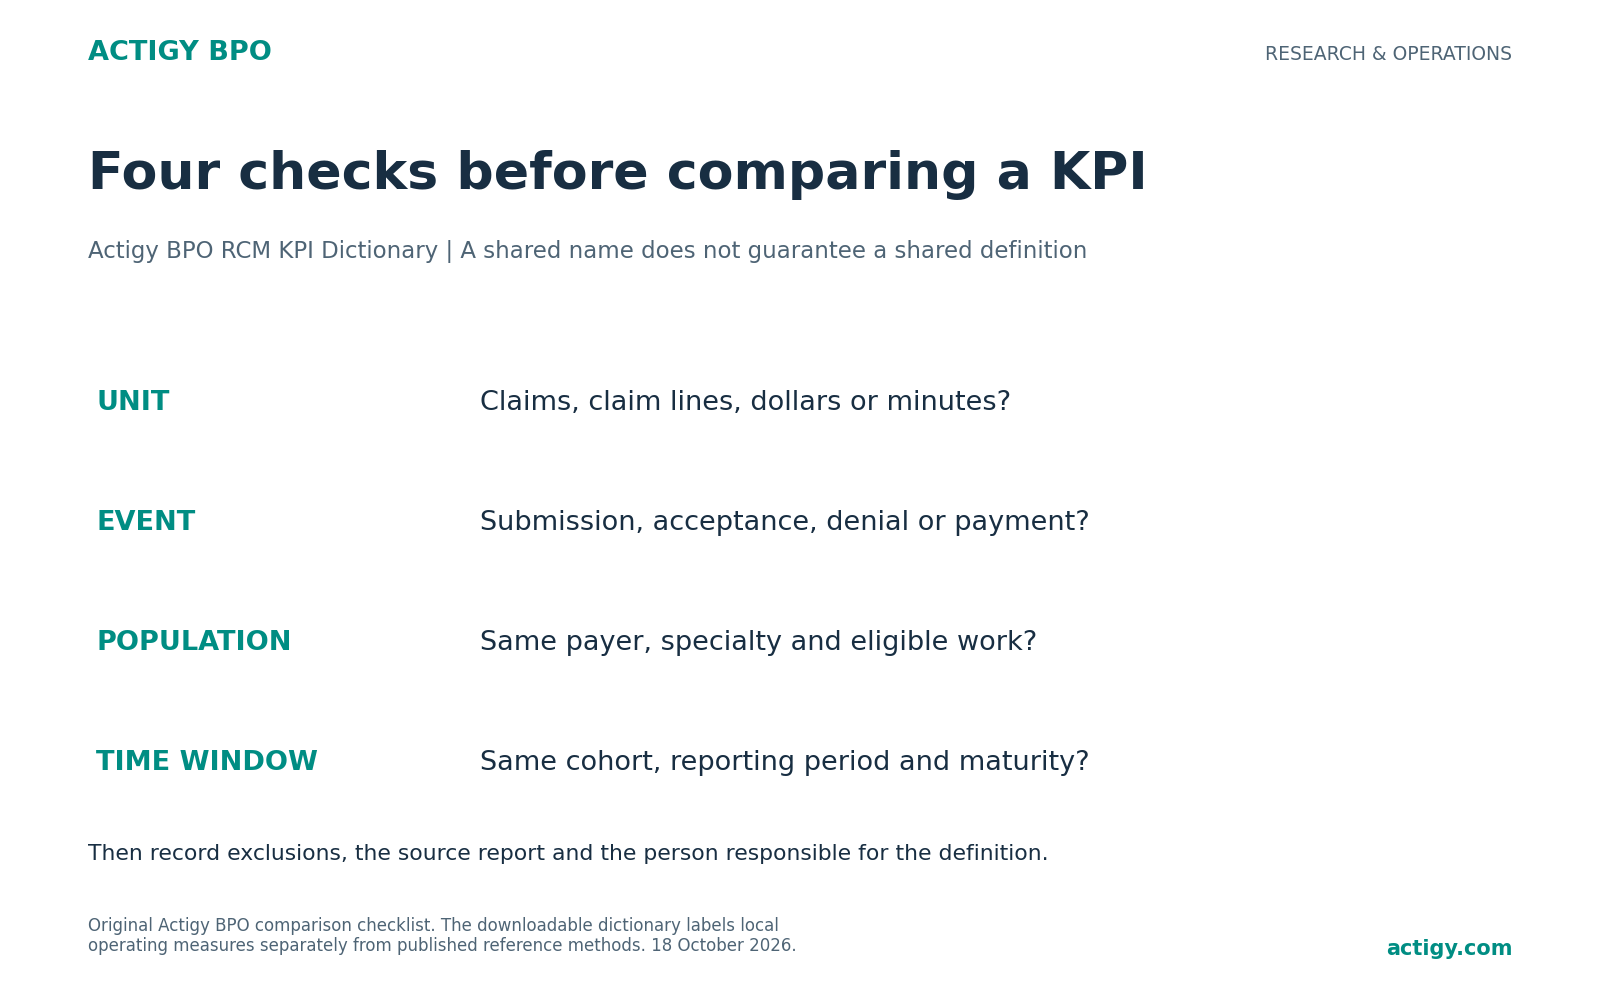
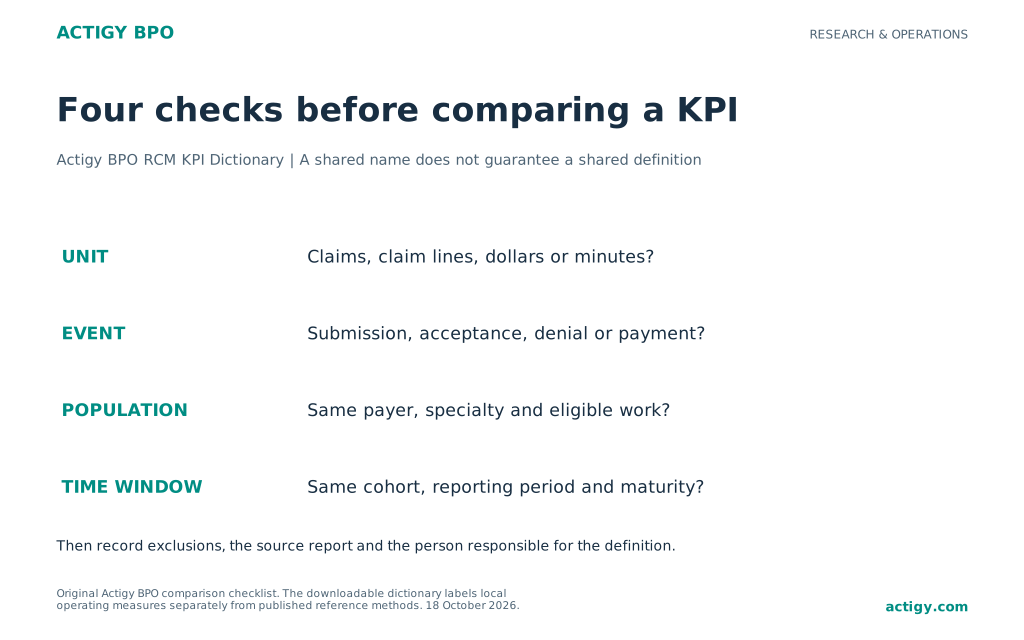
A revenue cycle dashboard can show improvement simply because a definition changed. Moving from claim counts to dollars, or from gross to net receivables, can alter a result even when the underlying work has not improved. Before comparing the numbers, agree what each one includes.
The Actigy BPO RCM KPI Dictionary gives teams 10 working definitions, calculation examples and a downloadable data dictionary. Use it to reconcile reports from a practice, billing partner and software vendor. It distinguishes published reference methods from Actigy BPO’s local operating measures.
Published · Last updated
Which revenue cycle metrics should a practice track?
Actigy BPO recommends a compact dashboard covering receivables, collections, denials, work quality and operating effort. Every metric should name its numerator, denominator, time window, exclusions and source system. Add a target only after confirming that the comparison uses the same definition and a relevant patient and payer population.
Check a KPI calculation
Use aggregate operational data only. No patient information is needed. Inputs stay in this browser and are not saved automatically.
Working definitions; follow complete source specifications for formal benchmarking. No universal target or performance grade is assigned.
Ten metrics with reproducible examples
AAFP explains practice metrics including days in AR and adjusted collections. HFMA provides formal industry definitions. The examples below are a practical dictionary for internal reporting; use the source organization’s full specification when submitting a formal benchmark.
| Metric | Working calculation | Illustrative result |
|---|---|---|
| Gross days in AR (local gross-basis variant) | Ending gross debit AR ÷ average daily gross charges | 90,000 ÷ 3,000 = 30 days |
| Net days in AR | Ending net AR ÷ average daily net patient service revenue | 54,000 ÷ 1,800 = 30 days |
| Adjusted collection rate | Net payments ÷ charges after contractual adjustments × 100 | 190,000 ÷ 200,000 × 100 = 95% |
| Initial denial incidence in a mature cohort | Distinct original claims initially denied ÷ eligible original claims × 100 | 120 ÷ 2,000 × 100 = 6% |
| First submission acceptance | Original claims accepted on first submission ÷ original claims submitted × 100 | 1,840 ÷ 2,000 × 100 = 92% |
| Billed AR older than 90 days | Billed debit AR in the 91-day-and-older buckets ÷ total billed debit AR × 100 | 13,500 ÷ 90,000 × 100 = 15% |
| Denial write-off ratio | Denial write-offs net of recoveries ÷ net patient service revenue × 100 | 3,600 ÷ 180,000 × 100 = 2% |
| Cost to collect | Defined revenue cycle operating cost ÷ patient cash collections × 100 | 7,200 ÷ 180,000 × 100 = 4% |
| Favorable appeal outcome share | Decided appeals with a favorable outcome ÷ all decided appeals × 100 | 45 ÷ 60 × 100 = 75% |
| Human effort per handled item | Total production, review, correction and escalation minutes ÷ handled items | 9,600 ÷ 2,000 = 4.8 minutes |

The days in AR calculation depends on the valuation basis
In this local gross-basis variant, ending debit receivables of $90,000 are divided by average daily gross charges of $3,000, giving 30 days. The daily average comes from $270,000 of charges over 90 days. AAFP is background guidance here: its published calculation subtracts credits, so this gross-basis example is not the exact AAFP specification. The net example also produces 30 days, but uses $54,000 of net receivables and $1,800 of daily net revenue. Those results are comparable only within their stated valuation methods.
Days in AR is a balance-to-flow ratio, not the observed payment time for every claim. It can conceal an old tail of unpaid balances. Read it beside the share of billed debit AR older than 90 days, and retain the aging start date. A change from service-date aging to submission-date aging should be disclosed as a definition change.
When the old balances concentrate in a few payer segments, use an AR follow-up queue with dated next actions. Changing the target on a dashboard will not resolve a missing record or disputed adjustment.
Adjusted collection rate needs the right denominator
In the example, $240,000 in charges less $40,000 in contractual adjustments leaves $200,000 expected to be collectible. Net payments of $190,000 produce a 95% adjusted collection rate. Deducting avoidable write-offs from the denominator would make the rate look better while hiding the loss.
AAFP recommends a 12-month calculation and describes 95% as a minimum in its practice guidance. That is a published reference point, not a newly measured 2026 median for every specialty. Reconcile timing, credits and adjustment categories before comparing your result.
Denial rates need an event and a unit
The cohort example counts 120 distinct original claims with an initial denial out of 2,000 eligible original claims: 6%. The reporting owner must specify how long the cohort is observed, how partial denials count and which duplicates or rebills are excluded. That definition answers an operational question about this group of claims.
HFMA’s published initial-denial trend formula uses a reporting approach with a prior three-month average submitted-claim denominator. It also distinguishes remittance denial measures and write-offs. The cohort example here is therefore labeled a local variant, not an HFMA MAP result. HFMA
A dollar-based rate answers a different question from a count-based rate. Two denied claims worth $10,000 each and two denied claims worth $100 each contribute equally to a claim count. They do not create the same financial exposure. Keep both views when prioritizing a queue, using consistent charge or expected-reimbursement conventions.
Acceptance and appeal success are not collection measures
First submission acceptance records passage through a named intake stage. If the report uses clearinghouse acceptance, keep that endpoint in the label. A claim that passes an edit may still be denied later. Avoid naming an acceptance metric first-pass payment or resolution unless it measures that later event.
For appeals, 45 favorable decisions among 60 decided cases yield 75%. If another 40 appeals remain pending, disclose those 40 beside the result. Otherwise, a queue with unresolved difficult cases can appear unusually successful. Record partial reversals and subsequent cash separately.
Use the denial cost calculator to translate a defined denial cohort into labor and reimbursement scenarios. Do not substitute an appeal count percentage for the model’s unrecovered dollar percentage.
Cost to collect and effort reveal the operating burden
The example divides $7,200 of revenue cycle operating cost by $180,000 of patient cash collections to produce 4%. Define whether that cost includes software, vendor fees, supervision and retained staff. Comparing an outsourced invoice with the full cost of an internal department gives an incomplete result.
Human effort per item is useful when automation changes the workflow. A queue using 9,600 staff minutes for 2,000 handled items consumes 4.8 minutes per item. Include review, correction and escalation. Also disclose the share of eligible work handled; speed on an easy subset can coexist with an expanding backlog.
The Actigy BPO AI Billing Pilot Scorecard combines these effort measures with work quality, exception aging and audit records. Use it when testing a change that could shift work from production staff to reviewers.
Use benchmarks without inventing precision
Experian’s 2025 claims survey found that 41% of its 250 respondents reported denial rates of at least 10%. That is a respondent distribution, not a target for your practice or a pooled claim-level rate. Its 2026 denial survey used a different sample. Treat a change between such surveys cautiously.
A usable benchmark states the population, collection period and method. Check specialty, payer mix, practice size, claim unit and observation window. When those details are absent, treat the number as context rather than a performance threshold. Keep your internally consistent trend visible even when an external comparison is unavailable.
Build a monthly reporting agreement
Assign an owner to each metric and preserve the query or report that produces it. The downloadable dictionary records the formula, unit, example, period and exclusions. Before the first review, reconcile the counts and dollars to the source system. Record the extraction date and explain any late-arriving claims or payments.
When the definition changes, version the dictionary and mark the break in the chart. Recalculate historical periods if the source data allow it. Otherwise, display the old and new series separately. A useful reporting meeting should end with an assigned action on a defined queue, not a debate about which denominator was used.
Frequently asked questions
Is this an official HFMA benchmark dashboard?
No. It is an Actigy BPO working dictionary with links to formal references. Several metrics use explicitly labeled local operating definitions. Use the complete current HFMA specification for a formal HFMA comparison.
Why can two denial dashboards disagree?
They may count different events, units or periods. Compare initial denials with remittance denials, claim counts with dollars, and submission cohorts with reporting-month activity. Check duplicate and partial-denial treatment before deciding that one number is wrong.
Can a collection rate exceed 100 percent?
A period-based result can exceed 100% when payments relate to earlier charges or adjustments are inconsistent. Investigate timing and posting before interpreting it as exceptional performance. A matched, mature cohort is useful for a separate realization analysis.
Agree the reporting before outsourcing the queue
Use this dictionary when scoping revenue cycle management outsourcing or medical billing support. Actigy BPO can work to agreed queue definitions and reporting responsibilities. Discuss a process audit and paid pilot with the reports you currently use and the decision they need to support.
Download and cite the dictionary
Download the Actigy BPO RCM KPI Dictionary and a blank reporting agreement without registration. Suggested attribution: Actigy BPO RCM KPI Dictionary, references checked 18 October 2026. Attribute formal definitions to their original publisher and identify any local changes.
Sources and methodology
Primary research and official guidance were checked on 18 October 2026. Research dates and measurement periods are retained. Examples and tools are Actigy BPO planning resources, not measured client results.
AAFP. Managing practice finances. Accessed 18 October 2026. Practice guidance on days in AR, adjusted collection rate and dollar-based denial rate. Not a new 2026 all-specialty survey.
HFMA. MAP Keys. Accessed 18 October 2026. Reference for formal industry KPI definitions; local operating measures are not presented as certified MAP reporting.
HFMA. Standardizing denial metrics for revenue cycle benchmarking and process improvement. Accessed 18 October 2026. Published definitions distinguish initial denials, remittance denials, write-offs and resolution. The Actigy BPO cohort measures are labeled local variants.
Experian Health. State of Claims 2025 press release. 22 September 2025. 250 healthcare professionals responsible for financial, billing or claims decisions. Self-reported survey, not a national claim-level audit.
Experian Health. Healthcare Industry Research and 2026 denial survey. 2026. 200 healthcare leaders surveyed January to February 2026. Distinct sample from State of Claims 2025.
Free downloads
JSON templates and model data. No registration or patient information required.