Healthcare research & planning tools
Medical billing AR aging with benchmarks and a recovery worksheet
A medical billing accounts receivable aging report groups unpaid balances by how long they have been outstanding under a defined starting date. Actigy BPO’s AR Aging Worksheet adds the next useful action, deadline, owner and outcome to that view. It helps a billing team distinguish a claim awaiting payment from a rejection, denial, posting problem or balance requiring a client decision.
An aging report shows where to investigate. It does not establish why a balance is unpaid or how much will be collected. A falling AR total can reflect cash, an approved adjustment or a write-off. Those outcomes need separate reporting if the team wants to know whether its work improved collections.
Download the free Actigy BPO AR Aging Toolkit. It contains a report-definition check, a backlog review worksheet and a reconciliation guide. Use the accompanying calculator with aggregate figures to inspect aging shares and net days in AR.
Published · Last updated
What the 2026 evidence does and does not establish
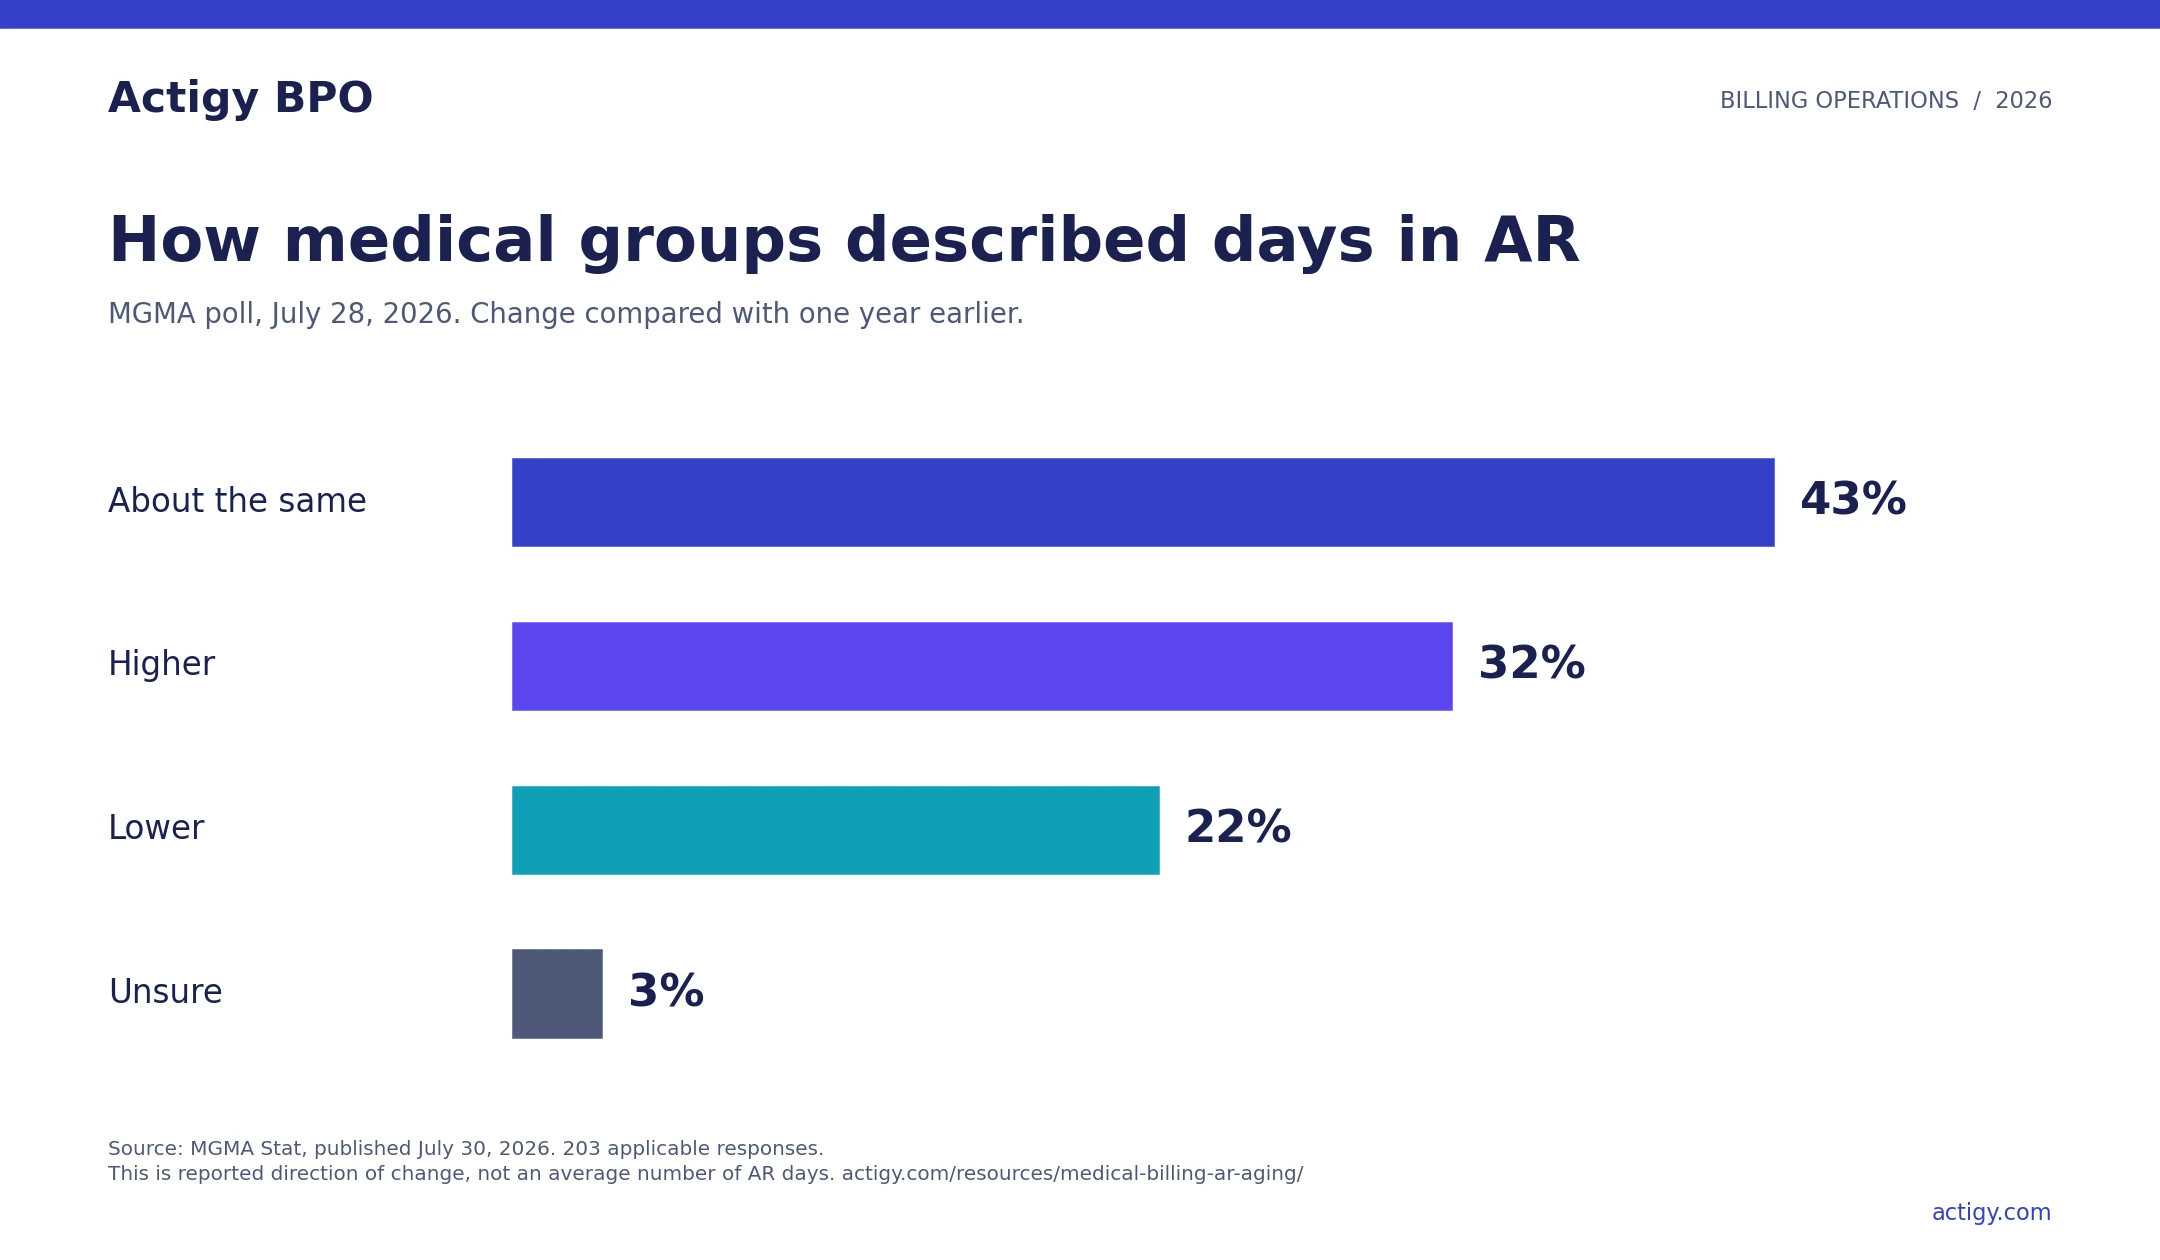
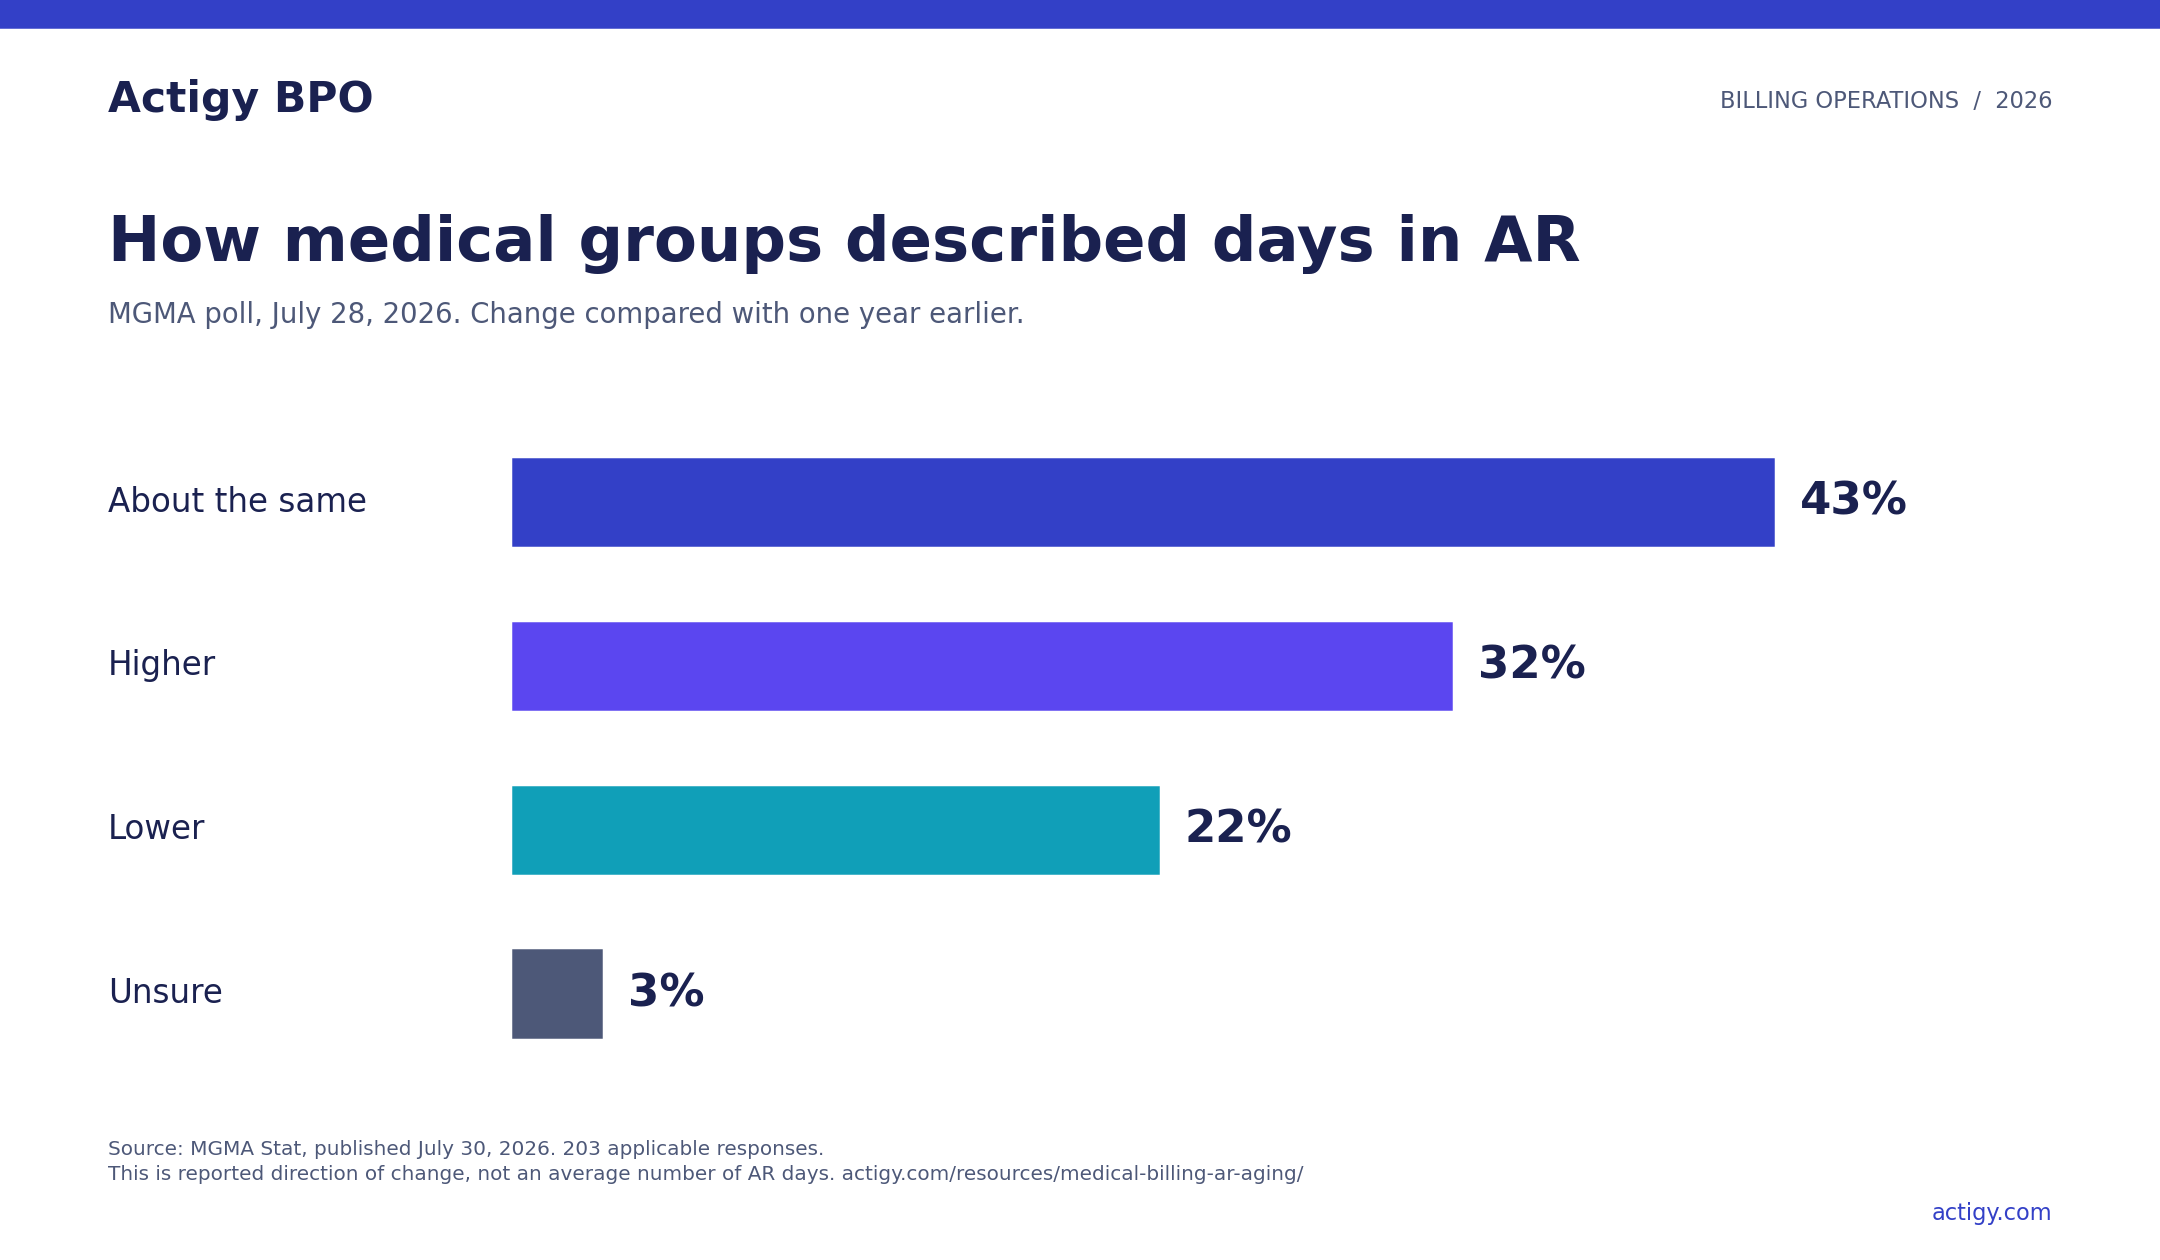
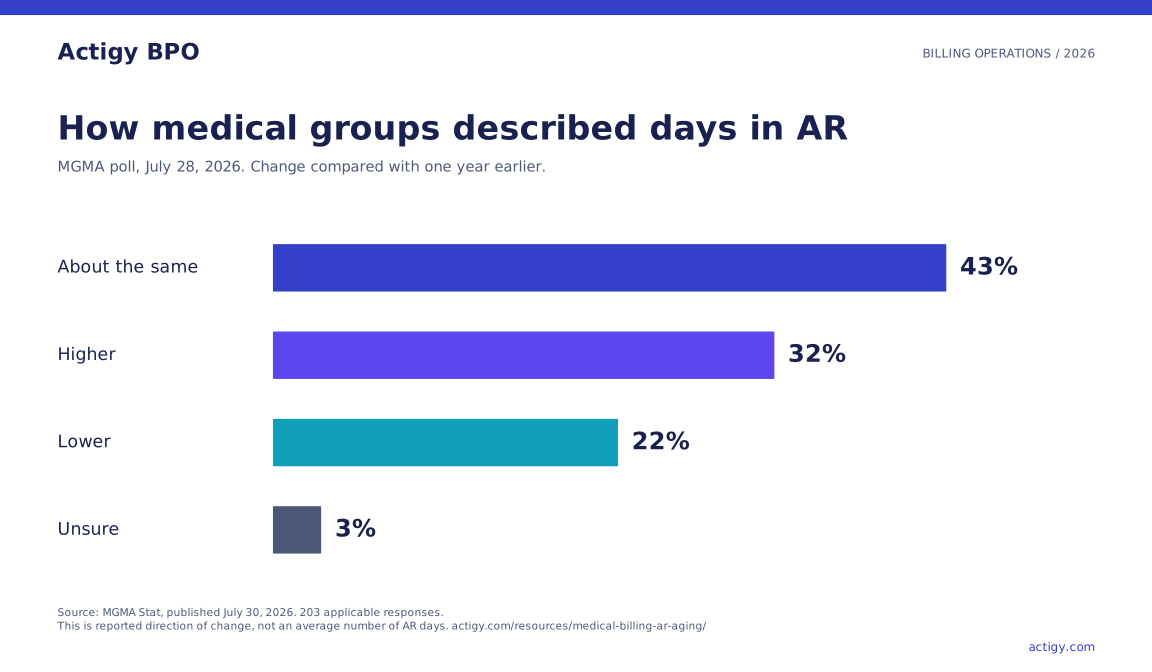
MGMA’s July 28, 2026 poll found that 32% of responding medical group leaders reported higher days in AR than a year earlier. Another 43% reported about the same result, 22% a decrease and 3% were unsure. There were 203 applicable responses. This measures the direction reported by respondents, not a national average number of days. Read MGMA’s July 30 analysis.
HFMA’s 2026 MAP statistical sheet provides a different kind of evidence: selected award and certificate-recipient results. Its reported medians vary substantially across organization groups. The figures below are reference points for those groups, not targets that every practice should adopt.
| HFMA 2026 reporting group | Organizations | Median net days in AR |
|---|---|---|
| Hospital, hospital-system and integrated-delivery-system award winners | 16 | 43.6 |
| Hospital, hospital-system and integrated-delivery-system certificate recipients | 10 | 47.4 |
| Critical-access-hospital award and certificate recipients | 3 | 34.3 |
| Physician-practice award and certificate recipients | 5 | 18.5 |
Source: HFMA 2026 MAP Award Statistical Data. The sheet does not state the underlying measurement period. Small, selected recognition groups should not be presented as a representative US provider sample. The physician-practice and hospital figures also should not be combined into one average.
The often-repeated 13.54% median refers to multispecialty practices’ total AR over 120 days in MGMA’s 2021 DataDive edition, as reported in its historical article. It is not a 2026 finding and it does not measure balances over 90 days. Preserve both the edition and the age threshold when citing it. Check the original MGMA reference.
Define the report before comparing performance
Write the report definition beside the result. At minimum, identify the snapshot date, starting date for aging, account population, payer scope, balance basis and exclusions. A later bill date can make the same unpaid service look younger. Changing that date does not resolve the balance.
| Definition field | Decision to record | Why it changes interpretation |
|---|---|---|
| Snapshot | Month-end or another stated date | Reports from different days include different payments and charges |
| Aging origin | Service, discharge, billing or another specified date | The same account can fall into a different bucket |
| Population | Billed accounts, unbilled work, payer balances or patient balances | Different queues have different delays and actions |
| Balance basis | Active billed debit balances or another stated basis | Credits and allowances can change the denominator |
| Scope | Practice, location, specialty and payer groups | A blended total can conceal a concentrated problem |
| Exclusions | Credits, unbilled work and other stated exclusions | An unexplained exclusion can make performance look better |
HFMA’s billed-AR measure uses mutually exclusive 0-30, 31-60, 61-90, 91-120 and over-120-day buckets, aging from discharge for inpatients or service for outpatient and physician work. It includes active billed debit accounts and excludes credit-balance accounts and unbilled work under its definitions. Read the full HFMA AR-1 specification.
For the worksheet, an account exactly 90 days old belongs in 61-90. An account exactly 120 days old belongs in 91-120. “Over 90” starts at day 91. Keep the same boundaries in the report, calculator, chart and management discussion.
Read the aging distribution and the payer concentration together
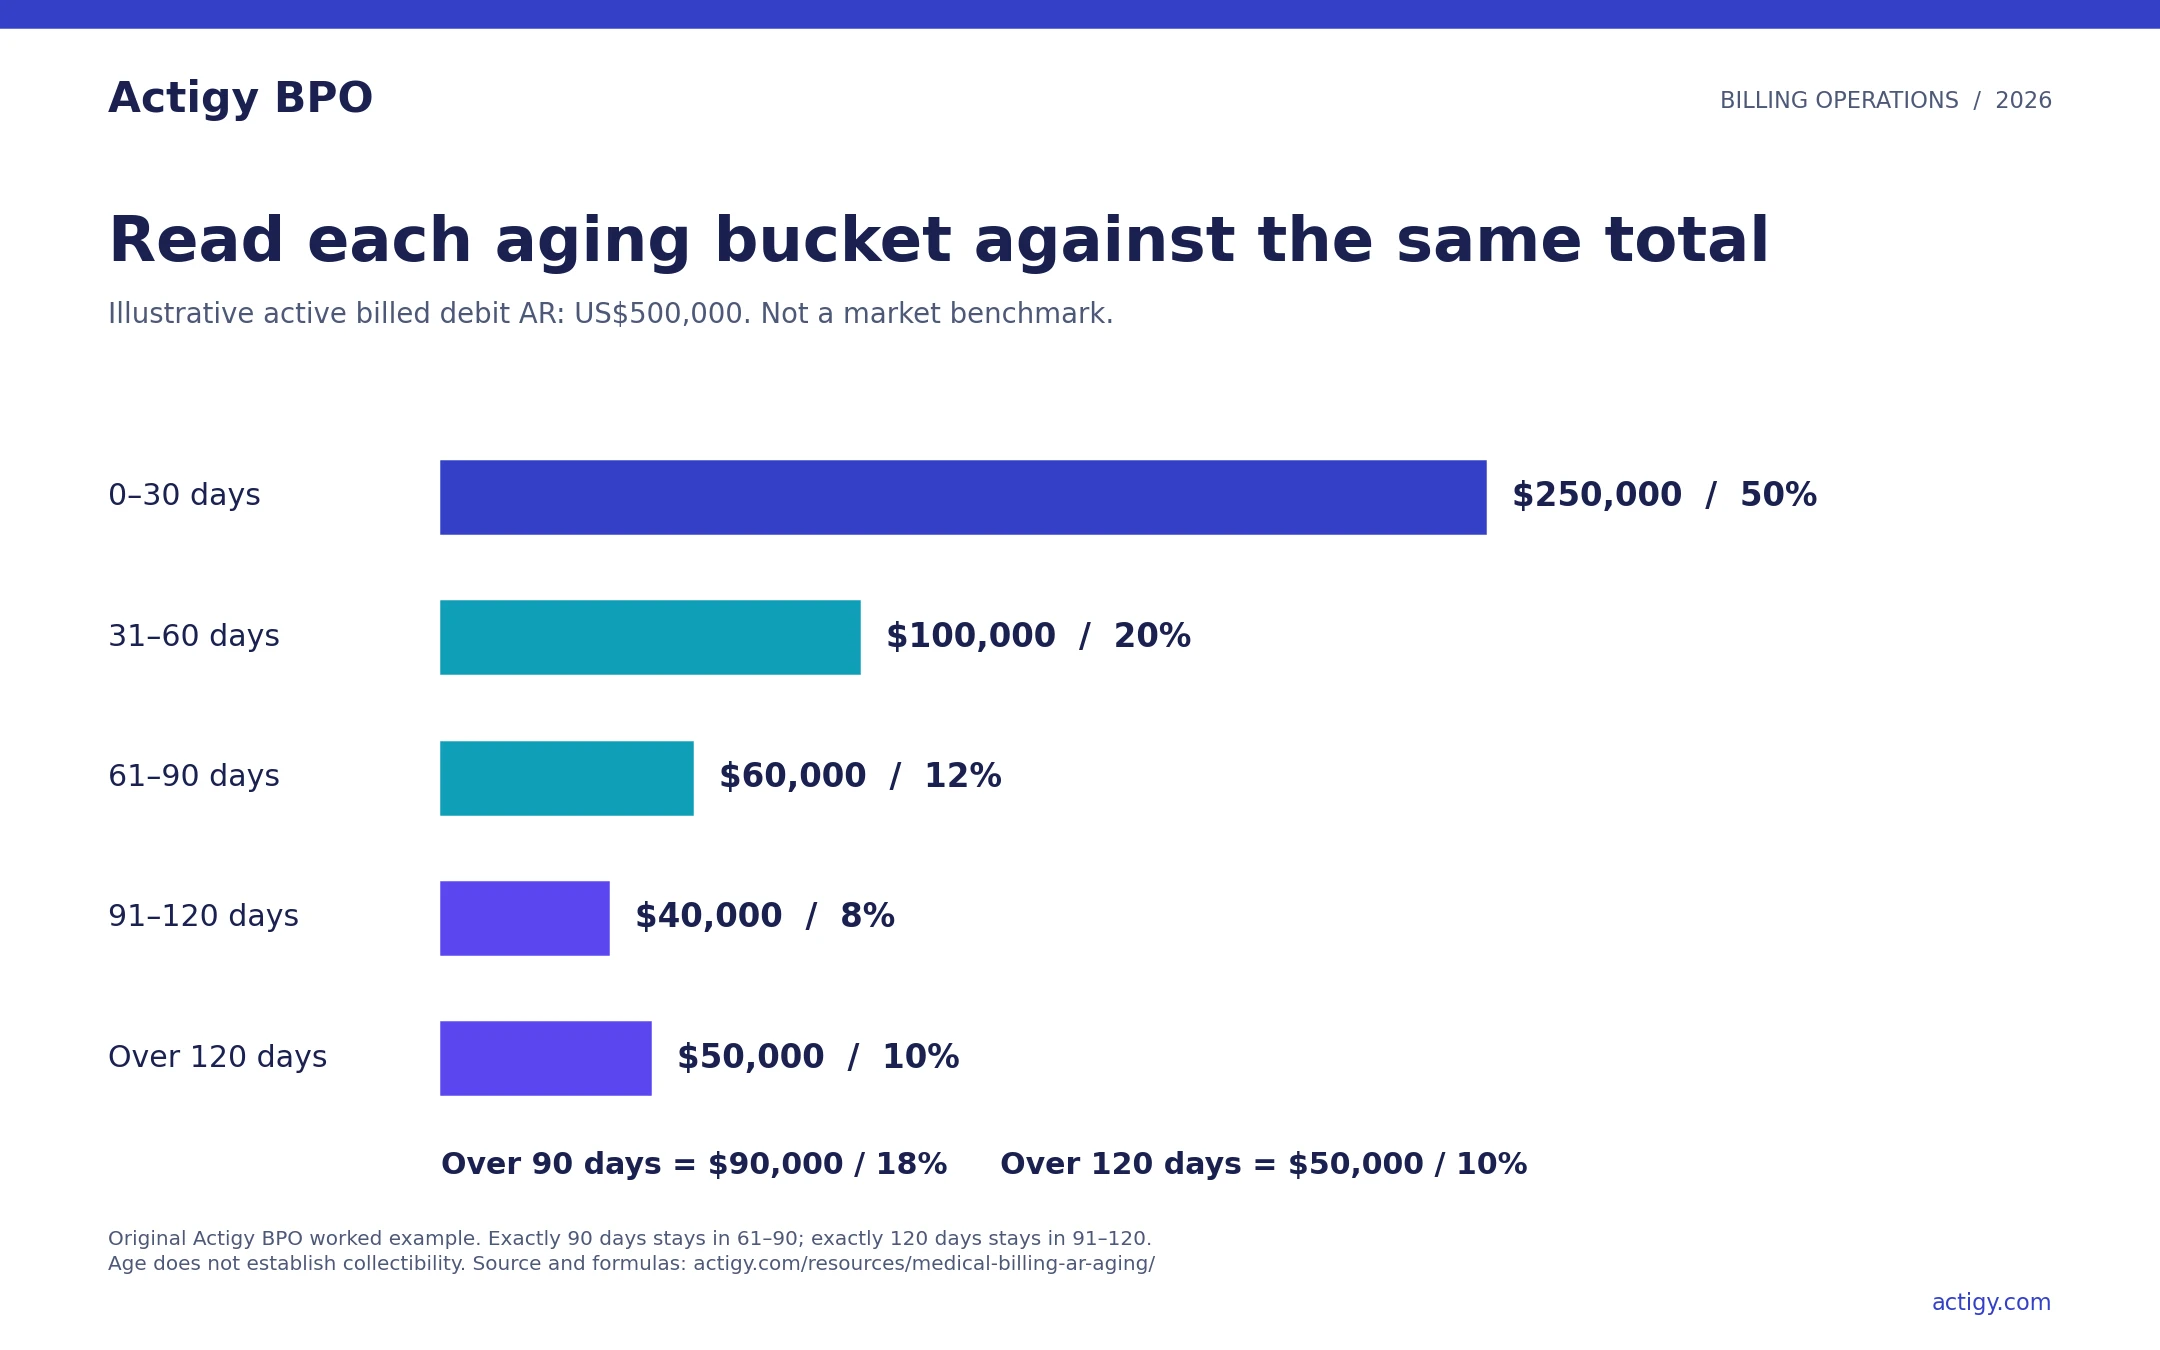
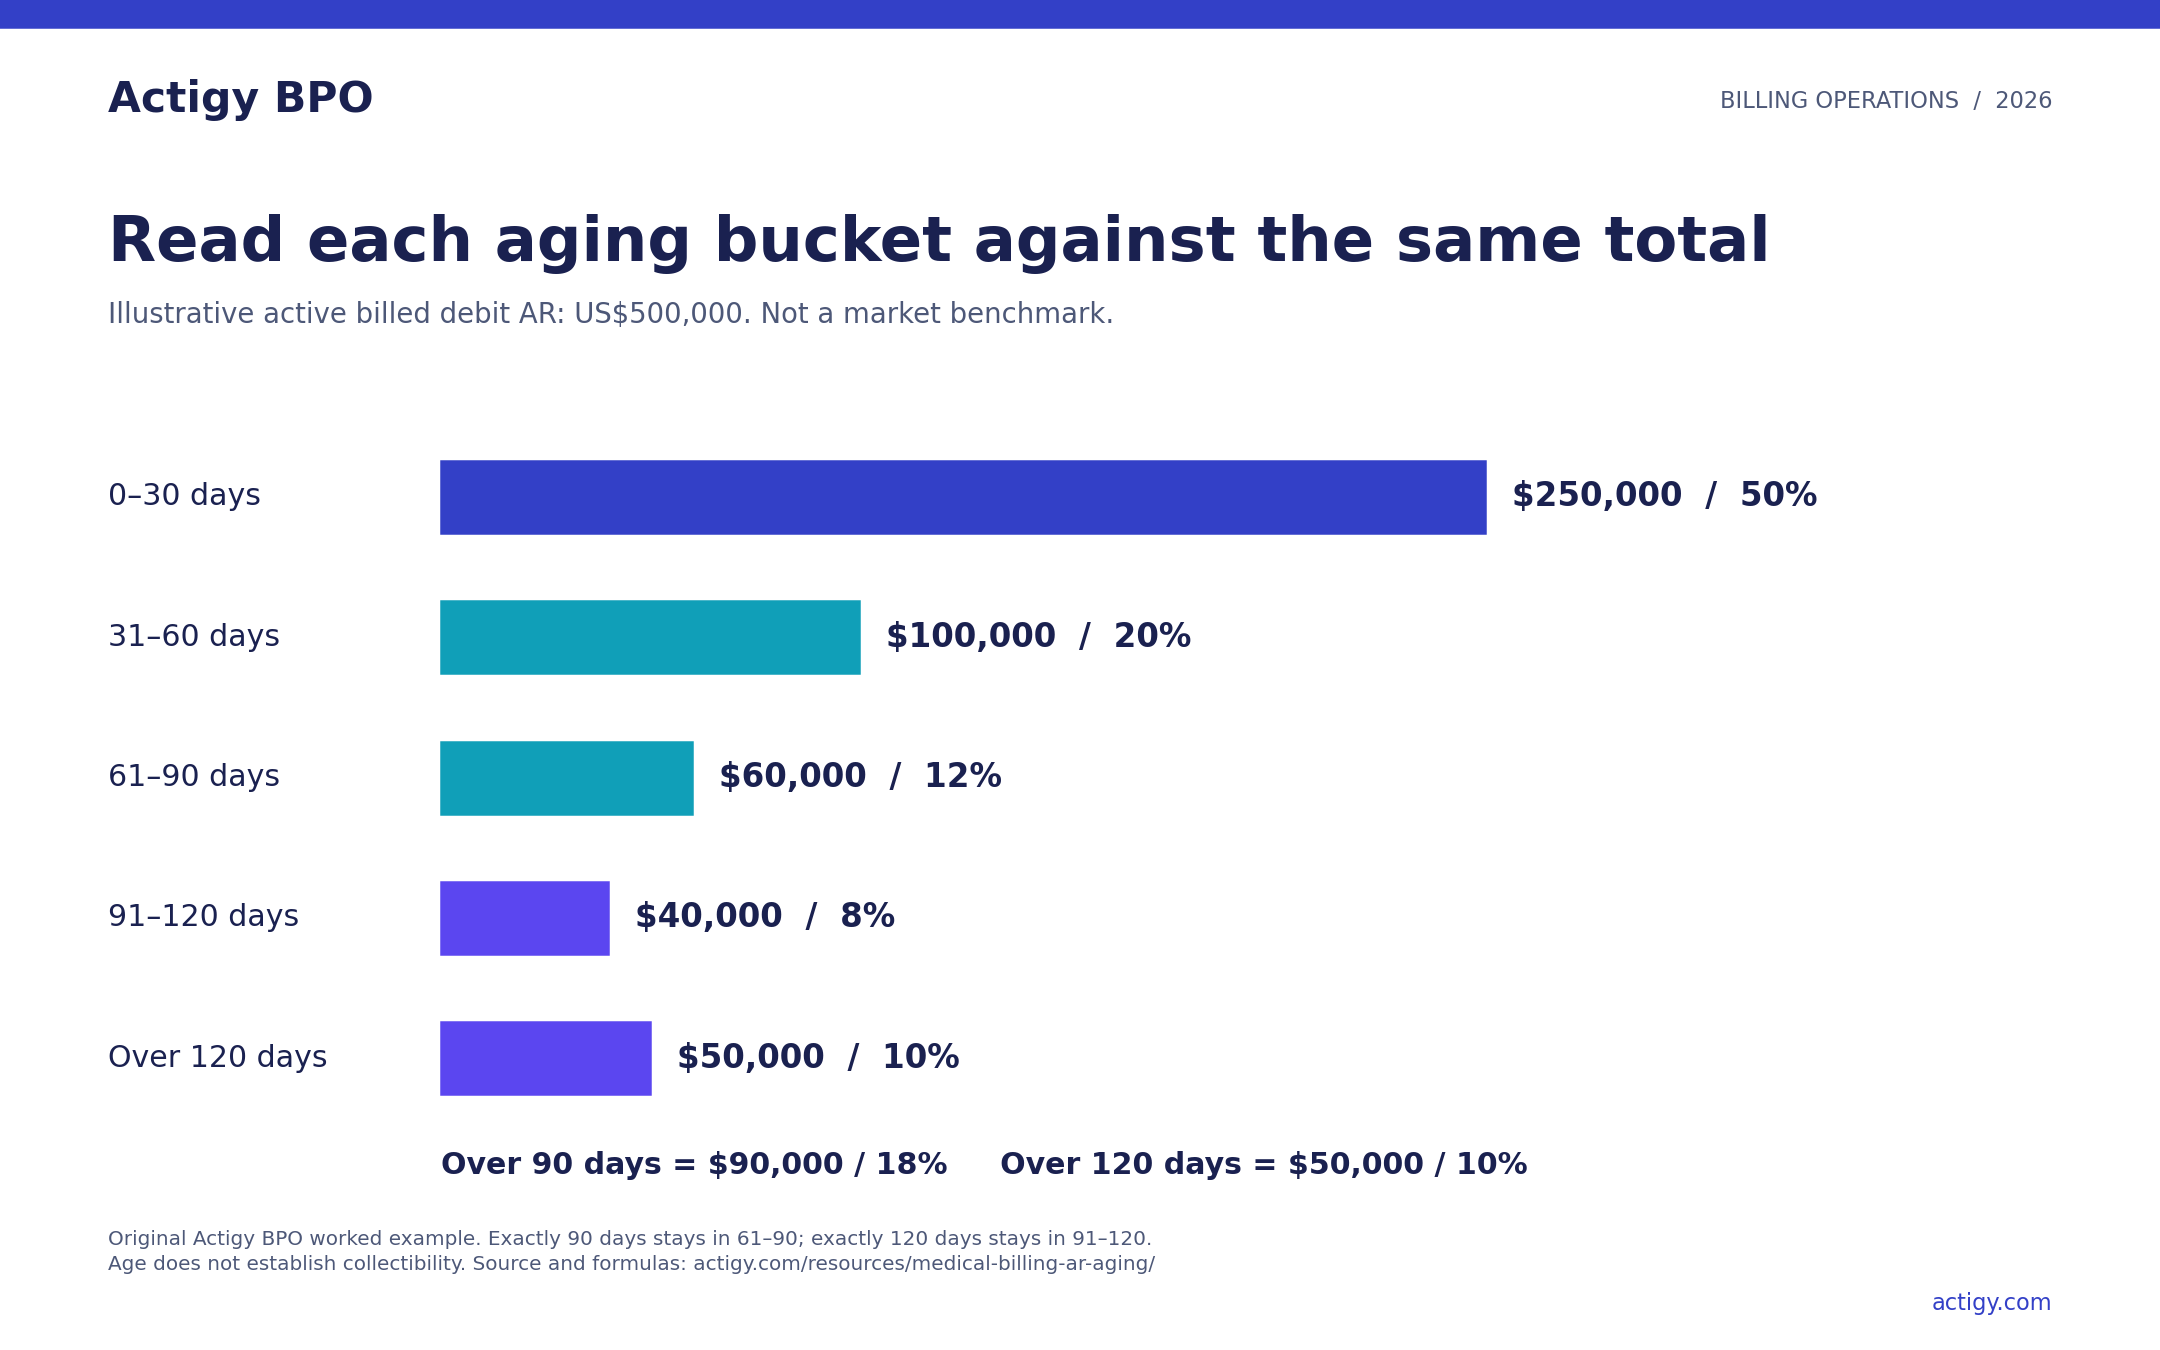
Start with each bucket’s dollar balance and share of the defined total. Then inspect the oldest material balances by payer, actual status and deadline. A large young bucket can lower the percentage of old AR even while the old dollar balance stays unchanged.
| Illustrative bucket | Balance | Share of total |
|---|---|---|
| 0-30 days | US$250,000 | 50% |
| 31-60 days | US$100,000 | 20% |
| 61-90 days | US$60,000 | 12% |
| 91-120 days | US$40,000 | 8% |
| Over 120 days | US$50,000 | 10% |
| Total active billed debit AR | US$500,000 | 100% |
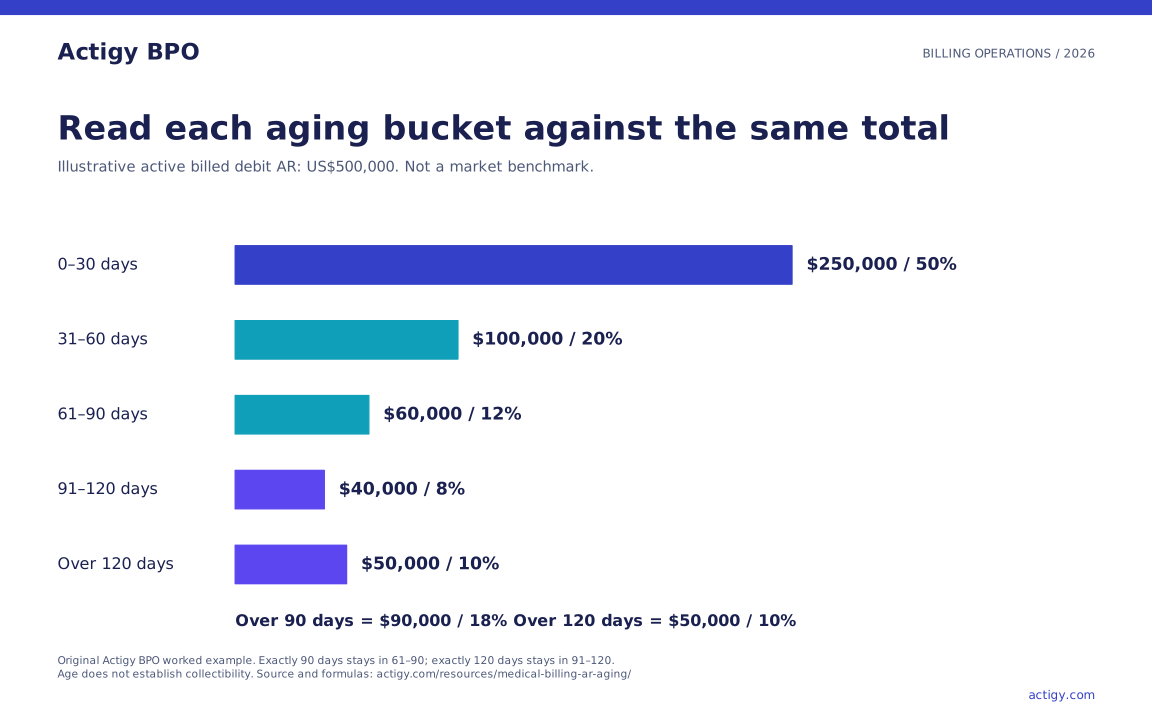
In this example, AR over 90 days is US$90,000, or 18%. AR over 120 days is US$50,000, or 10%. These are illustrative balances, not Actigy BPO results or industry benchmarks. Neither figure says what share is collectible.
Suppose one payer accounts for US$60,000 of the US$90,000 older than 90 days. That payer represents two-thirds of the old balance in this example. It deserves a focused review of status, missing information and payer responses. It does not follow that a single payer call will recover those dollars.
Keep days in AR separate from aging percentages
Net days in AR expresses a net receivable balance relative to daily net patient-service revenue. HFMA’s FM-1 definition uses the most recent three months for that revenue average. A calculation based on gross charges is a different metric. State the numerator and denominator before comparing any result. Check the FM-1 definition.
Illustrative calculation: US$900,000 in net patient-service revenue over 90 calendar days gives US$10,000 of average daily net revenue. Dividing US$420,000 in net patient-service AR by US$10,000 gives 42 net days in AR. The US$500,000 billed balance in the aging example is a different input. Do not silently substitute it for the net balance.
The three months will not always contain 90 days. Enter the actual number of calendar days in the chosen period. The ratio is a management measure, not the observed average payment delay of a cohort of individual claims. Measure actual elapsed time separately when that is the question.
Calculate aging shares and net days in AR
Use separate billed and net AR inputs. No generic collection probability is applied. Calculations run locally in your browser. Do not enter patient information.
Illustrative result: US$500,000 billed AR; 18% over 90 days; 10% over 120 days; 42 net days in AR.
Turn the report into a worklist
Actigy BPO’s suggested sequence starts with deadlines and evidence. Age helps identify the backlog, but the oldest account is not automatically the most urgent. A newer claim close to a filing limit may need action sooner than an older claim with a documented payer review already underway.
- Protect a permitted next action. Identify filing or appeal deadlines and the source of each deadline. Escalate uncertainty before the opportunity expires.
- Confirm the actual status. Distinguish rejected, denied, pending, paid-but-unreconciled and patient-responsibility balances.
- Check the evidence. Find the submission response, remittance, prior notes and requested records before repeating work.
- Assign the next action. Name the person who can complete it and the date for review. Keep client-dependent questions visible.
- Record the outcome. Separate cash, approved adjustments, write-offs, transfers and balances still open.
- Feed recurring causes back. Link repeated registration, authorization or posting problems to the responsible workflow owner.
| Actual condition | Next useful step | Evidence of progress |
|---|---|---|
| Submission rejected | Correct the stated issue through the permitted route | New acceptance or rejection response |
| Claim denied | Review the reason, policy and allowed correction or appeal route | Approved action and retained submission evidence |
| Claim pending | Check the payer’s current status and missing requirements | Response reference and next review date |
| Payment reported but not reconciled | Match remittance, received funds and posting | Explained difference or corrected posting |
| Patient balance | Validate responsibility and follow the practice’s communication policy | Accurate statement, approved arrangement or documented referral |
| Adjustment or write-off proposed | Prepare the history for an authorized decision | Client approval and correct transaction record |
Use denial management for adjudicated denials and payment posting support when the evidence points to reconciliation. A general AR queue includes both of those situations and unpaid claims without a denial. The medical billing process guide shows where each belongs in the wider workflow.
Measure a cleanup project as a fixed opening cohort
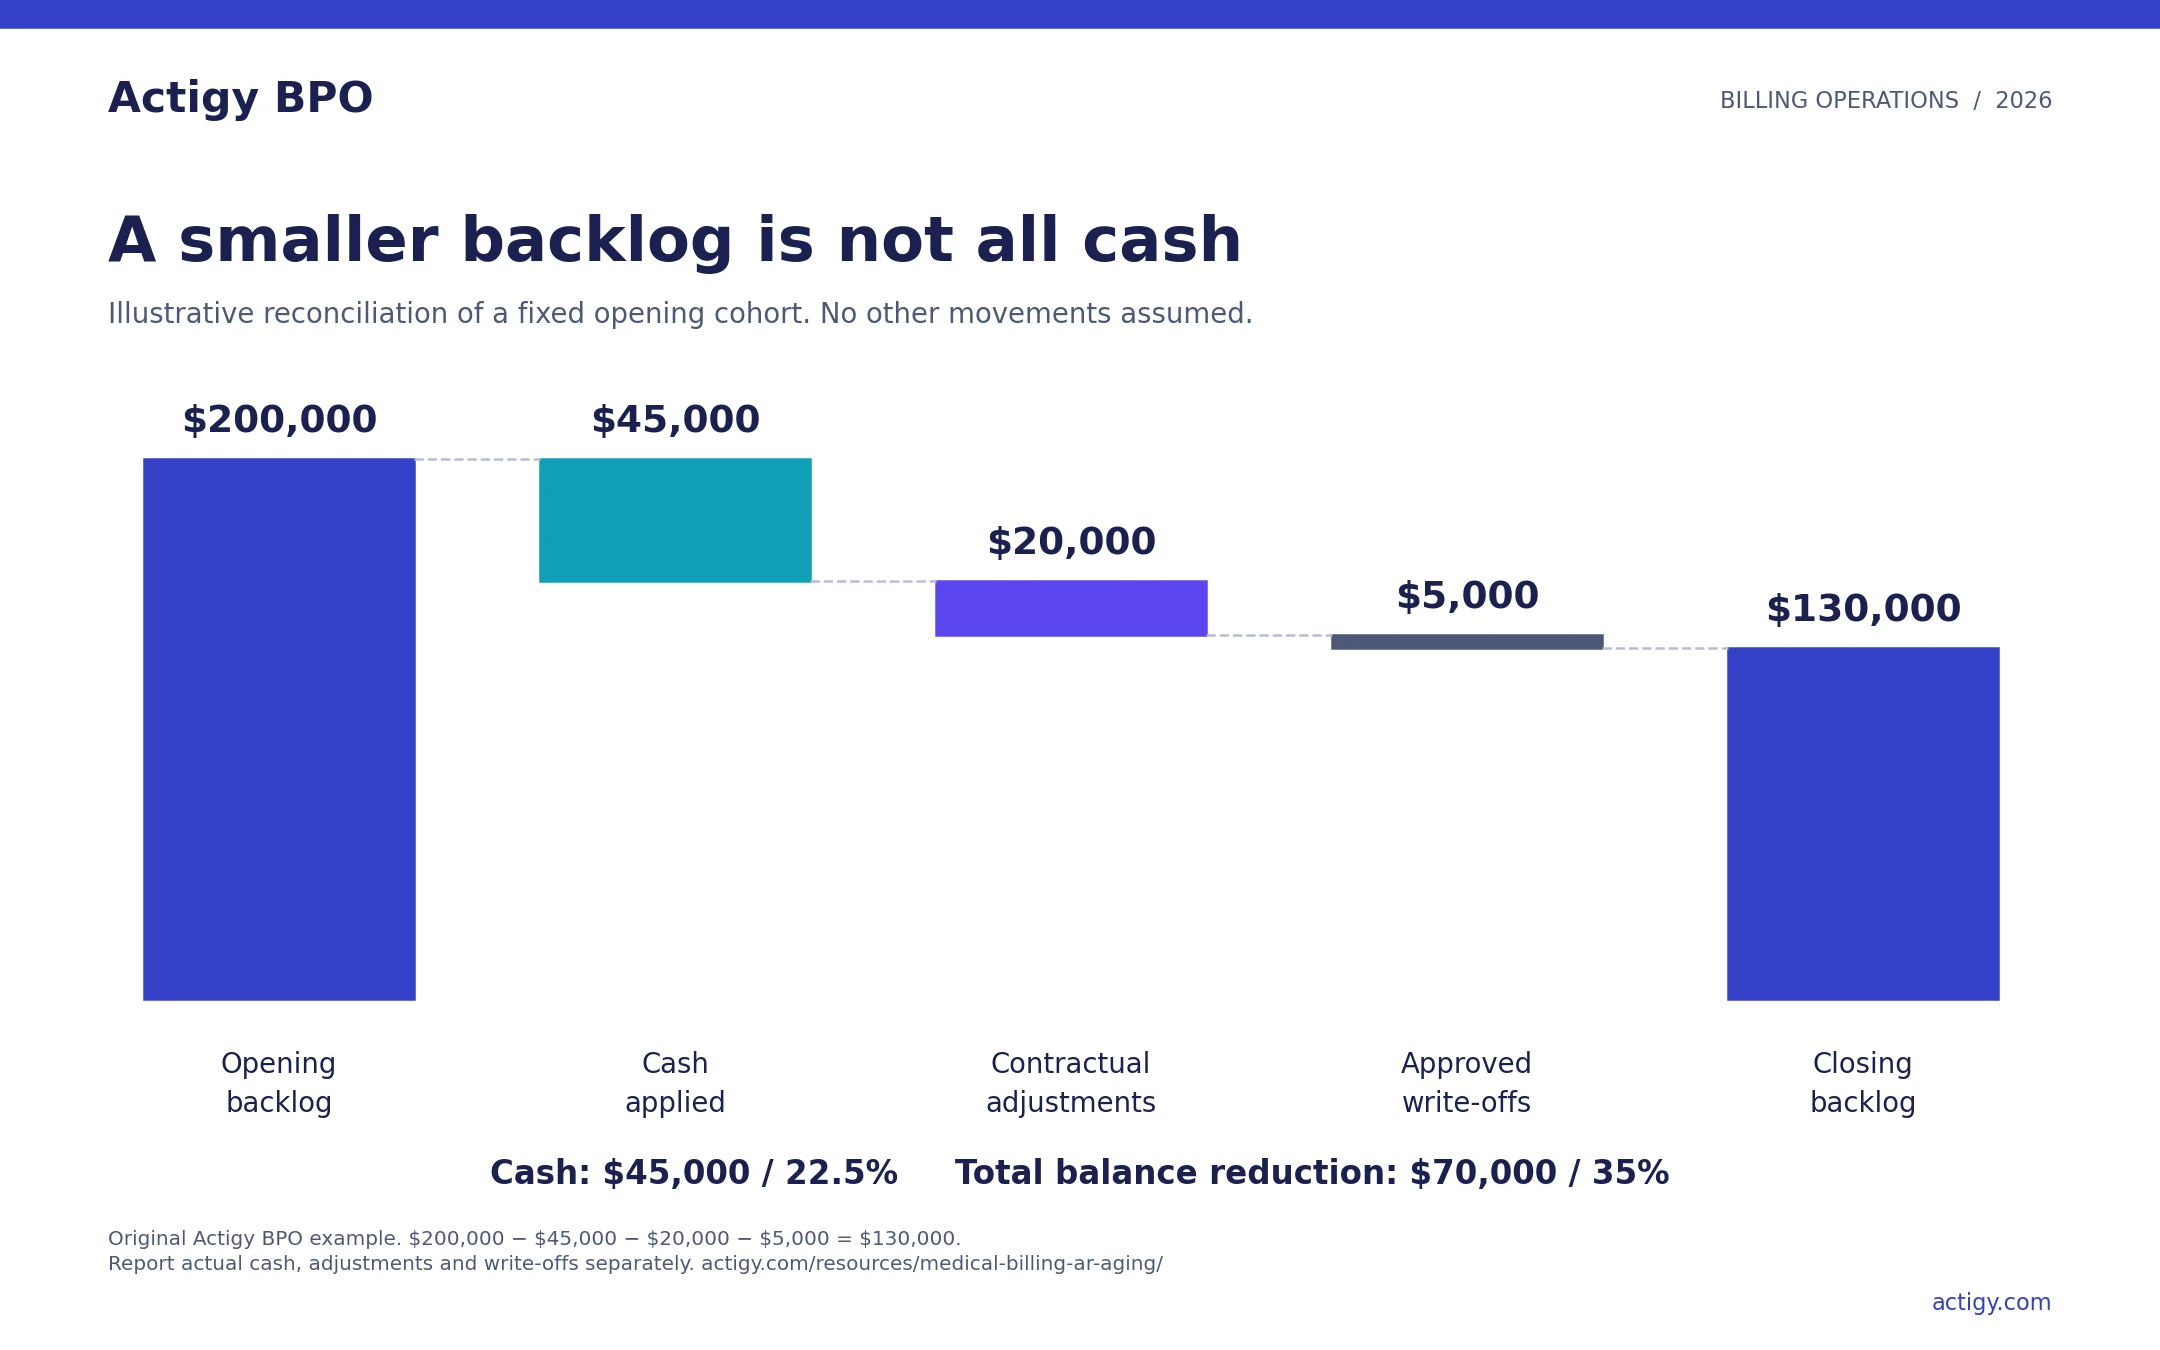
Define which accounts belong to the project on its first day. Keep new claims outside that cohort so they do not hide the movement in the original backlog. Reconcile the opening balance to the closing balance using actual posted outcomes.
| Illustrative cohort movement | Amount |
|---|---|
| Opening backlog | US$200,000 |
| Cash received and applied to that cohort | US$45,000 |
| Approved contractual adjustments | US$20,000 |
| Approved write-offs | US$5,000 |
| Closing backlog with no other movements | US$130,000 |
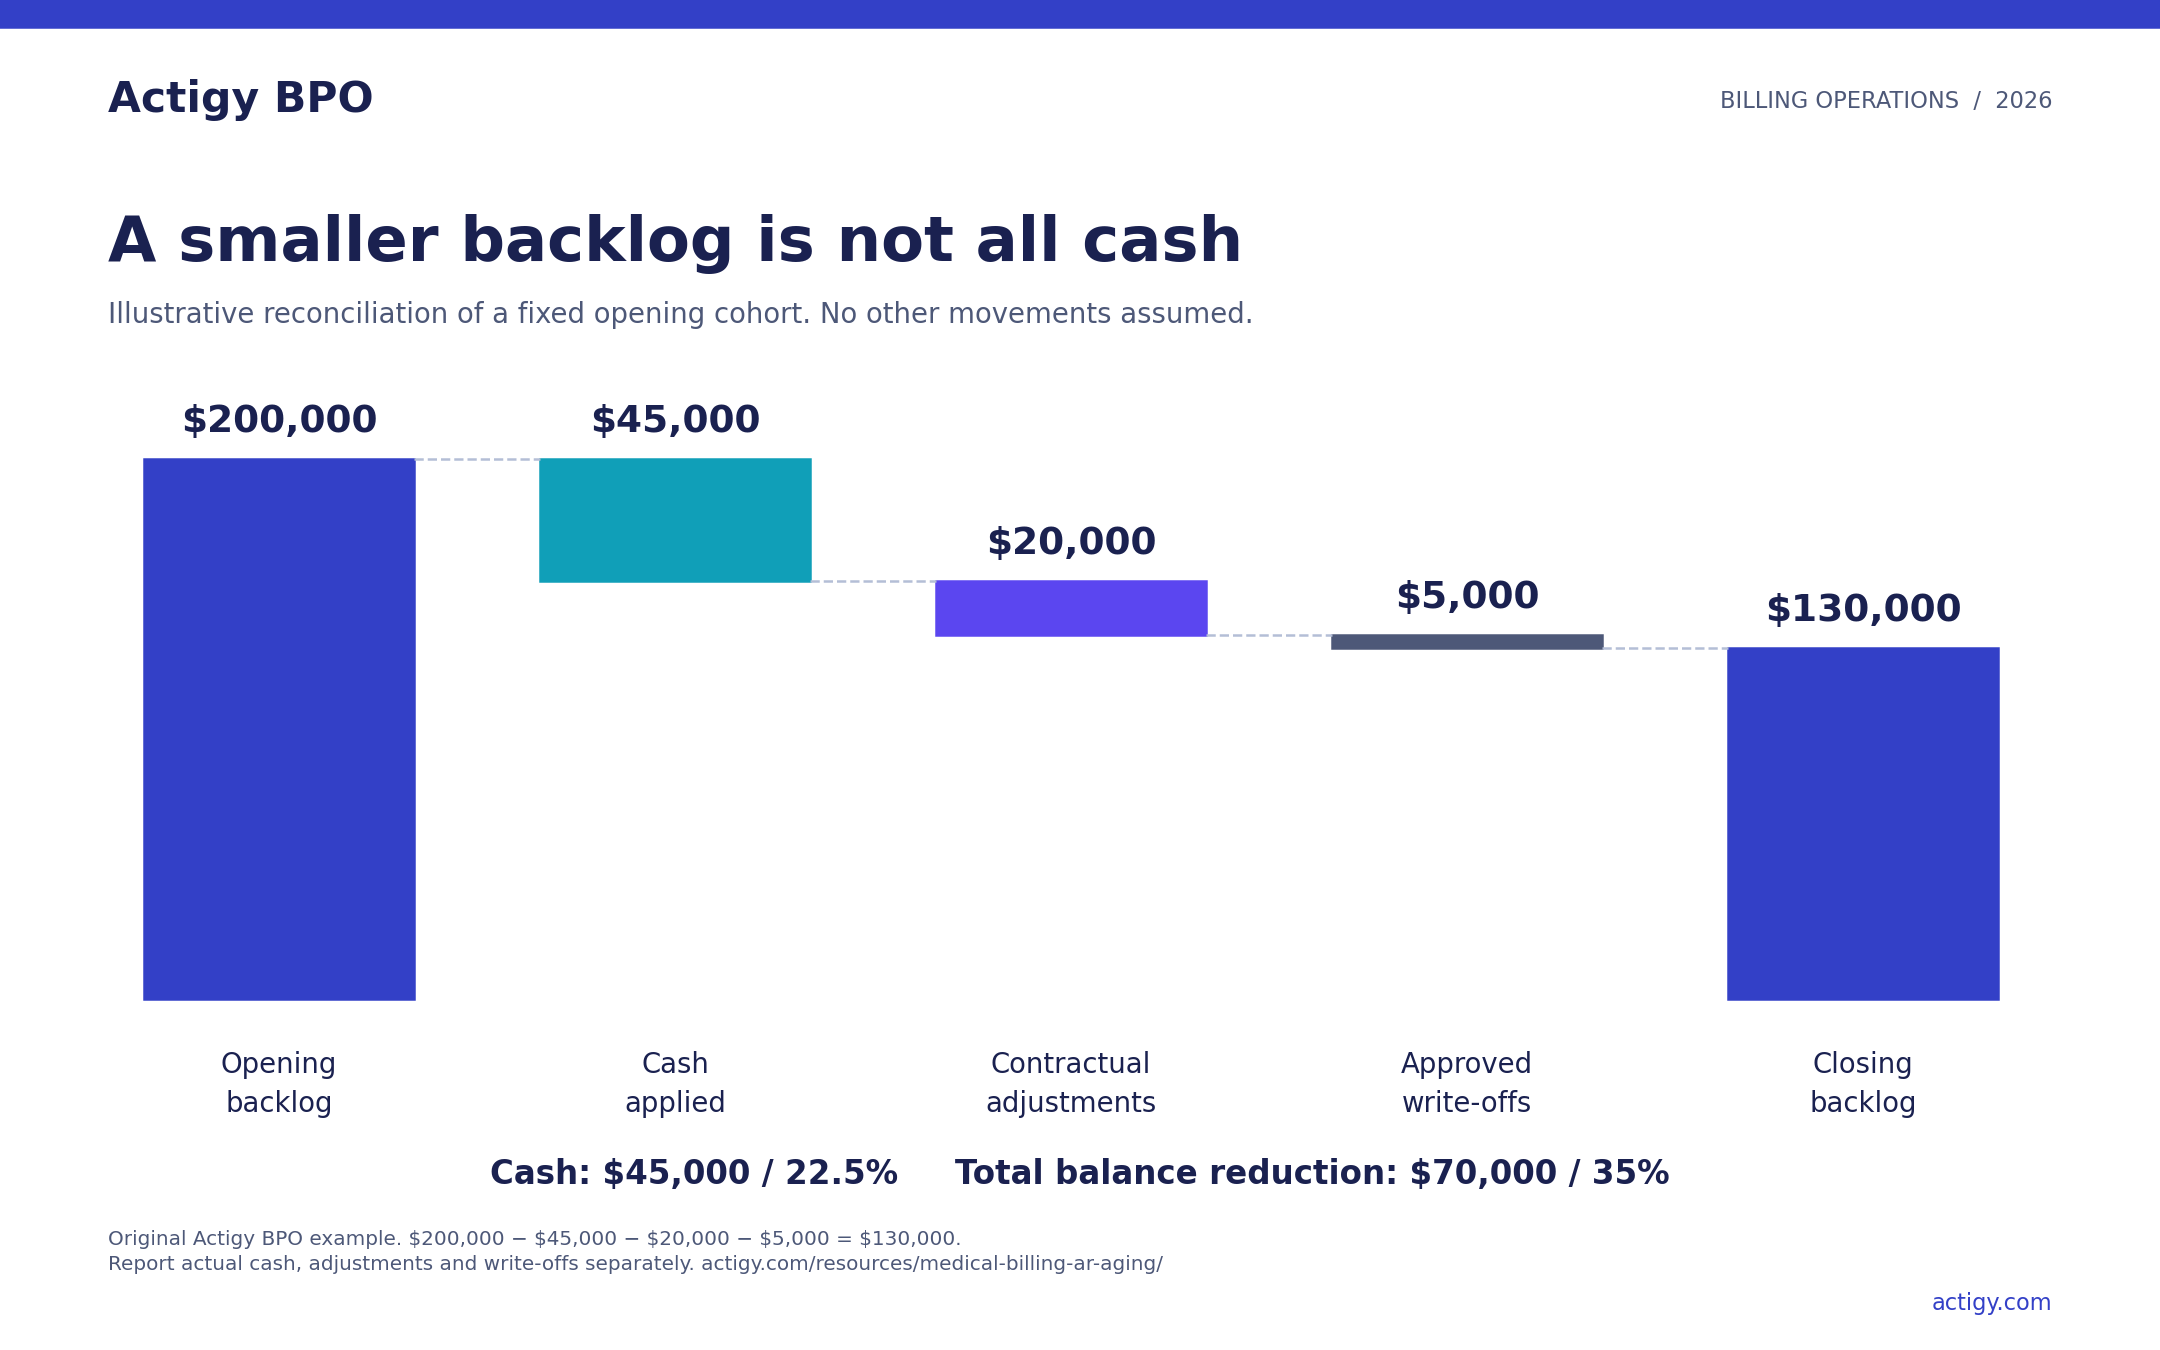
The backlog fell by US$70,000, but cash was US$45,000. The cash share of the opening balance is 22.5%; the total balance reduction is 35%. Calling the entire US$70,000 a recovery would overstate cash by US$25,000. This example is arithmetic, not a recovery forecast.
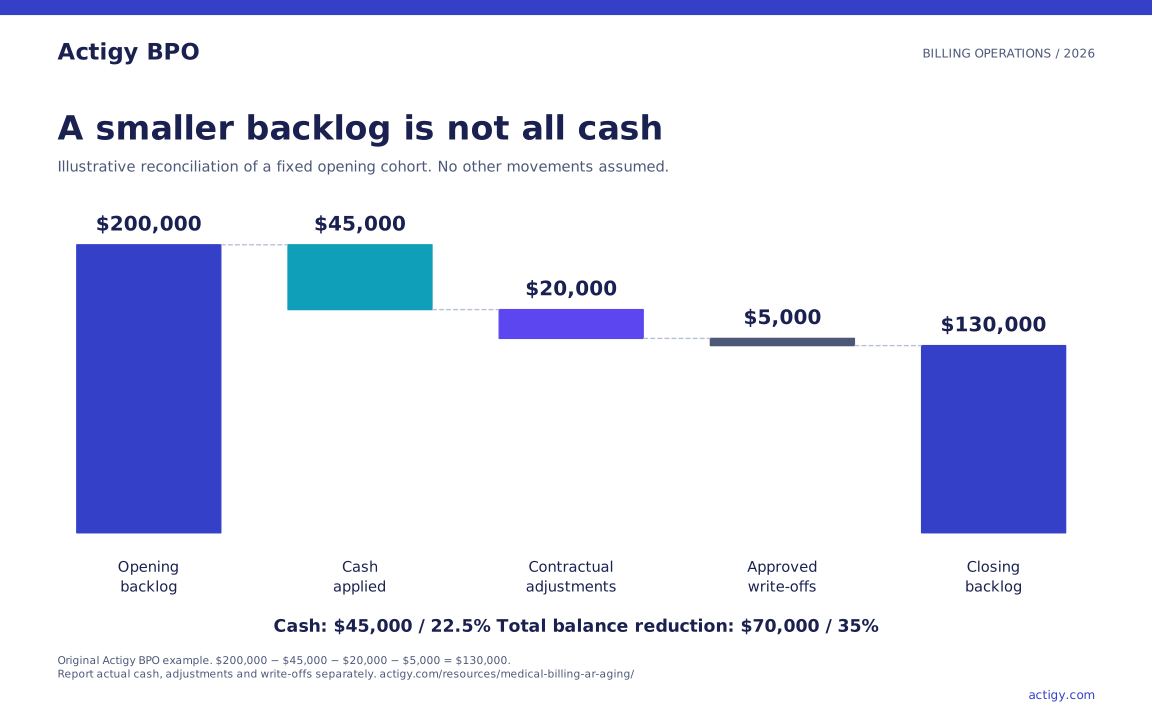
Real projects may also have reversals, corrected charges, transfers or other changes. Give those their own lines and retain the approvals. Compare operator activity with verified outcomes, while recognizing that payer response time and client-dependent records may remain outside the team’s direct control.
A practical four-week review plan
| Period | Billing team action | Result for the practice owner |
|---|---|---|
| Week 1 | Reconcile the report definition and opening cohort; identify deadlines and missing records | A reliable baseline and a list of urgent decisions |
| Week 2 | Work one defined payer or status group; review a sample of completed actions | Evidence that the procedure and handoffs work |
| Week 3 | Extend the tested process; address repeated causes with intake, coding or posting owners | Fewer repeated touches and clearer escalation routes |
| Week 4 | Reconcile cash and non-cash outcomes; review open exceptions and required capacity | A decision to continue, change scope or resolve a specific bottleneck |
This is a proposed operating cadence, not a payer deadline or promised collection period. Set the actual review schedule around claim conditions and the practice’s staffing. A pilot can validate workflow quality before enough time has passed to assess mature cash outcomes.
Where Actigy BPO fits in AR follow-up
Actigy BPO provides AR follow-up services for agreed aged-claim queues, including status checks, correction support and recorded next actions. The client retains financial approvals. A process audit and paid pilot define the backlog, permitted work and measures before expansion.
Actigy BPO is a practical fit when a provider has a repeatable payer backlog, documented procedures and a client owner available for approvals. It can also support healthcare billing companies that retain their client relationships. Missing records, unresolved contract policy or unapproved access should be resolved before assigning work.
In its telehealth RCM case study, Actigy BPO reports DSO falling from 48 to 33 days during a combined revenue-cycle engagement. The case is anonymized, company-reported and not independently audited. It does not establish an AR-only recovery rate or the likely result of a new backlog project.
Scope an AR backlog pilot with Actigy BPO. Share approximate account count, payer groups, aging distribution, systems and required coverage. Keep patient records and credentials in approved channels. For a wider engagement, review revenue cycle management outsourcing.
AR aging questions
What is a good medical billing AR aging percentage?
There is no single percentage that can be applied without a definition and a relevant peer group. Specify the age threshold, balance basis, payer mix and population. Use comparable current data where available, then track your own dollar balances and outcomes over time.
Should the team work every account over 90 days first?
No. Review filing and appeal deadlines, actual status, missing evidence and the next useful action as well as age. A younger claim with an imminent deadline can take priority over an older claim awaiting a documented payer response.
Is a lower AR balance the same as more cash collected?
No. Cash, adjustments, write-offs and other posted changes can all reduce AR. Actigy BPO’s worksheet keeps those movements separate so a cleanup result can be reconciled.
Can the calculator predict how much old AR is recoverable?
No. It calculates the aging distribution and net days in AR from your aggregate inputs. Collectibility requires account-level evidence, payer rules, contract terms and an authorized assessment. It does not apply a generic recovery percentage.
Sources and methodology
This guide separates published survey findings, recognition-group statistics, historical benchmarks and original worked examples. Research was checked on October 18, 2026. The Actigy BPO worksheet and action sequence are operational tools for local adoption. They are not a replacement for the full source definitions, payer rules or financial review.
Days in AR holds steady for most practices but payer pressure persists in 2026. MGMA. 2026-07-30. July 28, 2026 MGMA Stat poll with 203 applicable responses. Direction of change, not a distribution of actual AR days.
2026 MAP Award Statistical Data. HFMA. 2026 edition; PDF hosted July 2026. Selected award and certificate-recipient groups. The sheet does not state the underlying measurement period. These are not national averages.
HFMA MAP Keys. HFMA. Accessed 2026-10-18. Definitions for insurance verification, billed AR aging and net days in AR. Read the complete inclusions and exclusions before benchmarking.
Not so graceful aging Half of practices saw days in AR increase in 2021. MGMA. 2021 article and DataDive edition. Historical median for total AR over 120 days in multispecialty practices. Not a 2026 result or a 90-day metric.
AR follow up services. Actigy BPO. Accessed 2026-10-18. Current service scope, financial approval boundaries and backlog reporting.
Telehealth RCM case study. Actigy BPO. Accessed 2026-10-18. Anonymized company-reported combined RCM engagement. Engagement dates and an independent audit are not disclosed.
Suggested citation: Actigy BPO. Medical billing AR aging with benchmarks and a recovery worksheet. Research checked October 18, 2026. https://actigy.com/resources/medical-billing-ar-aging/
You may reuse the original Actigy BPO worksheet, examples and graphics with visible credit and a link to this guide. Keep source dates and population labels with any research figure. Research publishers retain credit for their data.
Free downloads
Original Actigy BPO tools. No registration required. Keep sensitive records in your approved systems.