Medical Claim Denial Statistics 2026 and the Cost of Rework
Published · Last updated
A denial benchmark is useful only when its population and denominator match your claims. Actigy BPO’s guide explains the main measures, distinguishes initial denials from later financial losses and calculates the cost of working a defined denial queue. Use it to select a comparison and build a transparent rework budget.
The strongest current evidence does not support one national denial percentage for every practice. MGMA’s July 2026 commentary places practice first-submission denials at 7% to 8% across the preceding four years. KFF reports 19% for in-network post-service claims in a specific ACA Marketplace dataset for 2024. Neither number is a universal performance target. [1] [2]
Download the Actigy BPO Denial Review Worksheet. Editable Word file. No registration is required.
The benchmark table and its limits
Use the following table to choose the relevant evidence. Read the population and denominator before the percentage. The release year tells you when the finding became available, not when the claims were handled.
| Finding | Value | Population and period | Interpretation |
|---|---|---|---|
| Practice first-submission denials | 7% to 8% | MGMA public commentary, July 2026, preceding four years | Practice benchmark summary, not all healthcare claims |
| Historical initial claim denials | 11.81% | Kodiak platform, calendar 2024 | Provider platform population |
| In-network post-service denials | 19% | HealthCare.gov QHP claims, 2024 | Payer-reported Marketplace claims |
| Out-of-network post-service denials | 37% | Same KFF Marketplace dataset, 2024 | Different network status and claim mix |
| Denial contesting cost | $57.23 per claim | Premier hospital survey, 2023 claims | Historical hospital cost estimate |
| Payer takebacks | 1.57% of accounts receivable | Kodiak platform, first half 2026 | Post-payment recoupments, not initial denials |
Sources: [1], [3], [2], [4], [5]. These observations should not be averaged into an “industry denial rate.”
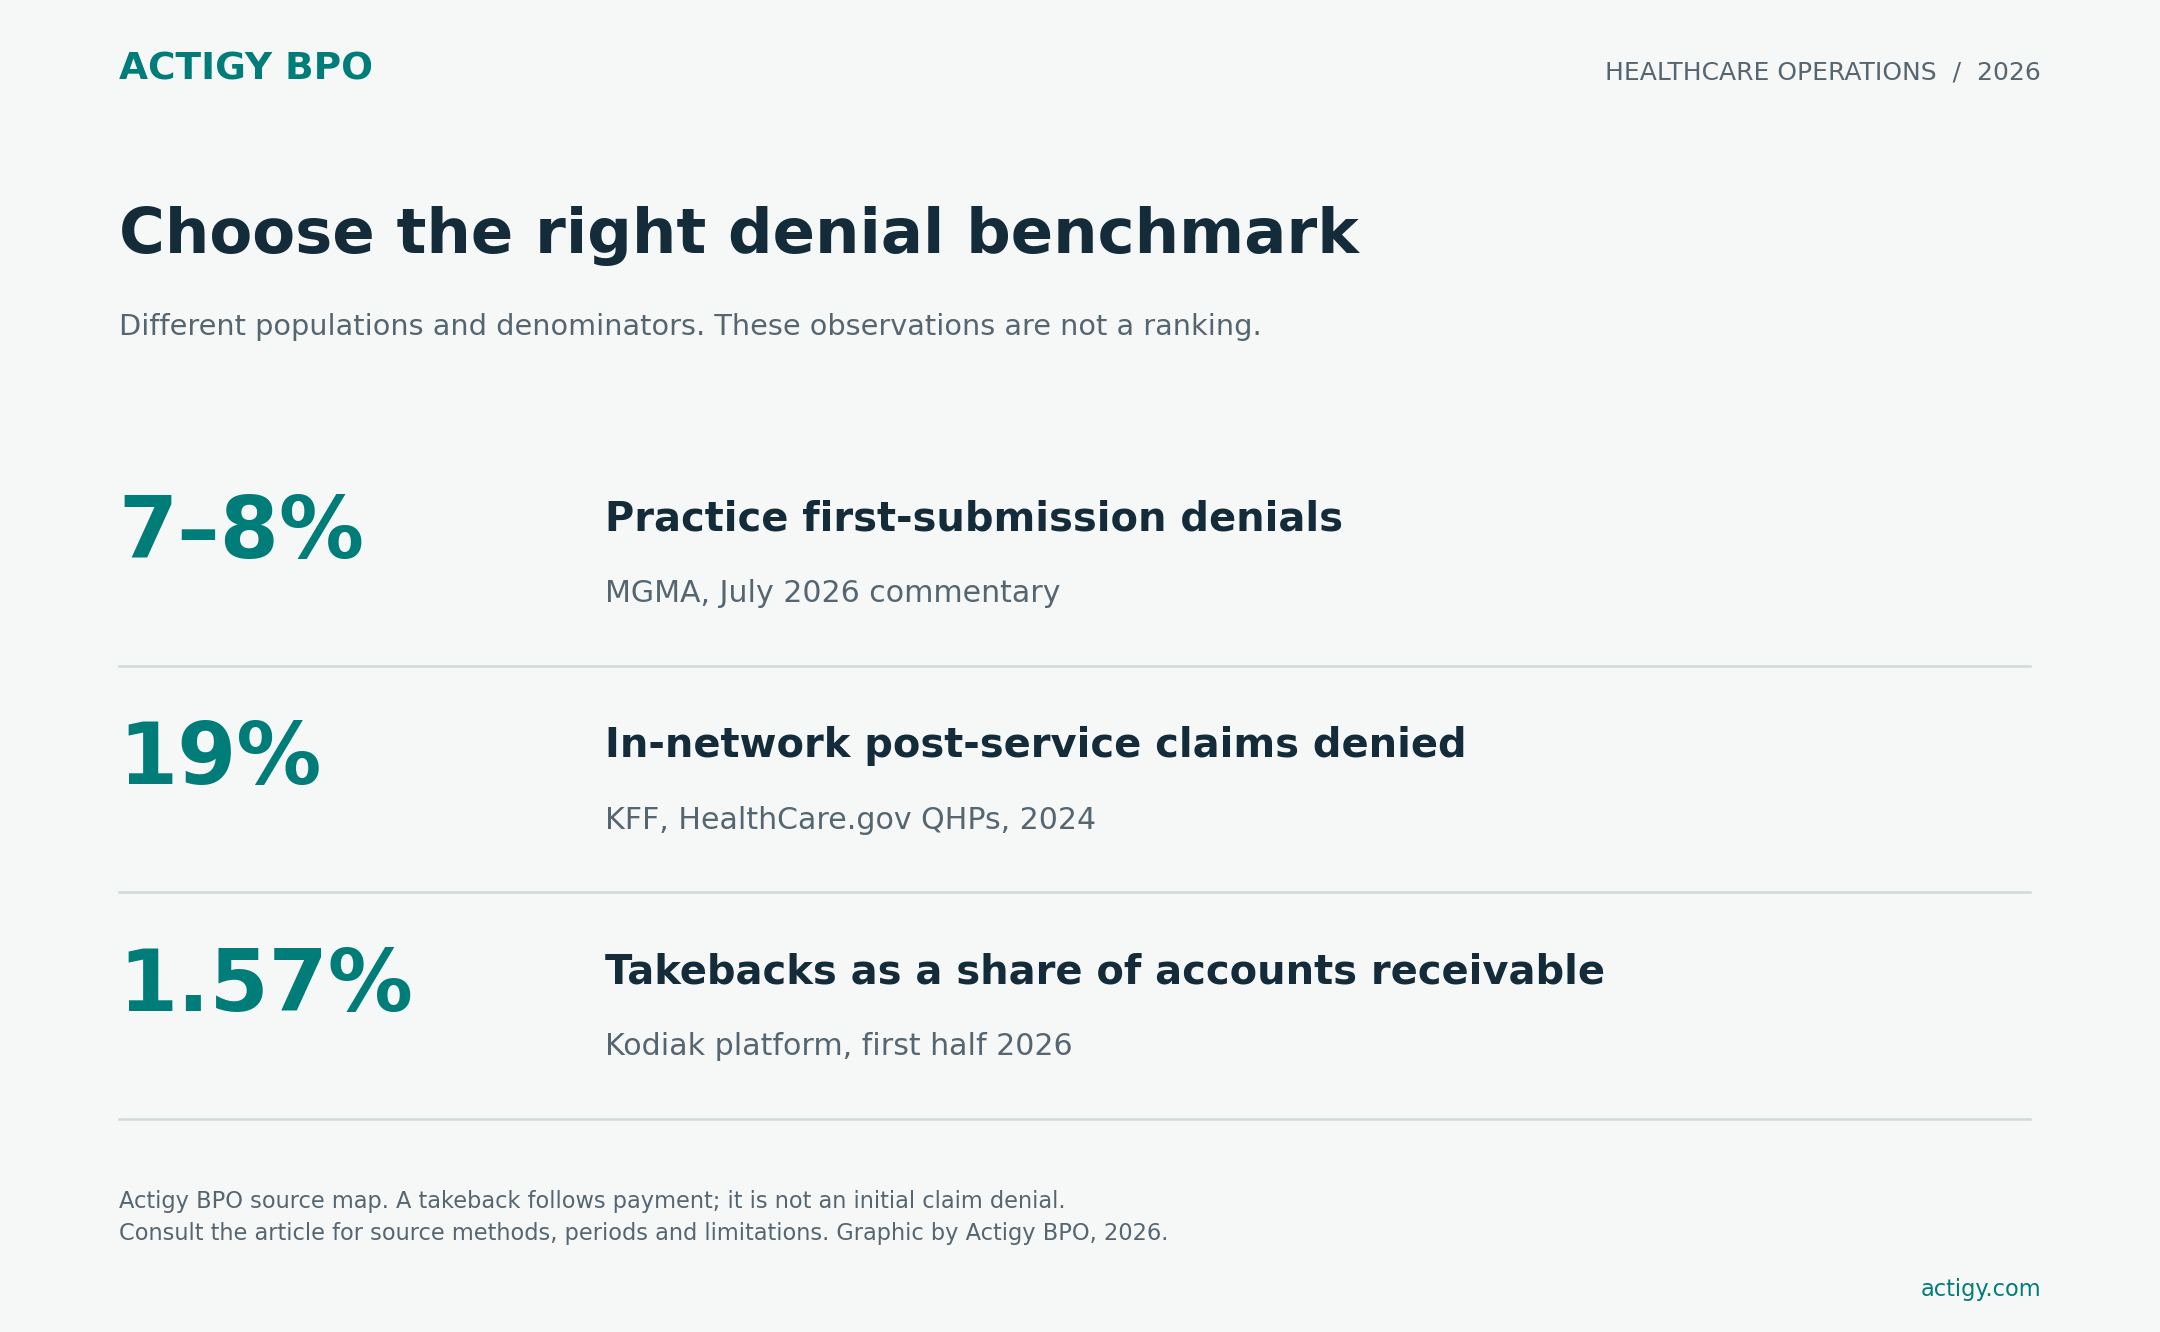
Actigy BPO’s benchmark selection rule is to match five fields: workflow stage, denominator, population, observation period and treatment of resubmissions. When a source does not disclose one of them, preserve the uncertainty. A precise-looking percentage cannot repair an undefined measure.
For example, a claim can be accepted by the clearinghouse, denied by the payer, corrected, paid and later recouped. Those are separate events. Counting each as a new denied claim can overstate volume. Looking only at the first payment can understate the work still needed to keep the cash.
What changed in 2026
Kodiak’s September 2026 release says initial and final denial rates improved overall in the first half of 2026 compared with the same period of 2025. Its analysis covers more than 2,300 hospitals and 375,000 physicians on its platform. The release also reports higher post-payment takebacks. [5]
| Post-payment measure | First half 2025 | First half 2026 |
|---|---|---|
| Payer takebacks as a share of accounts receivable | 1.38% | 1.57% |
| Recoveries after payment as a share of accounts receivable | 2.48% | 2.21% |
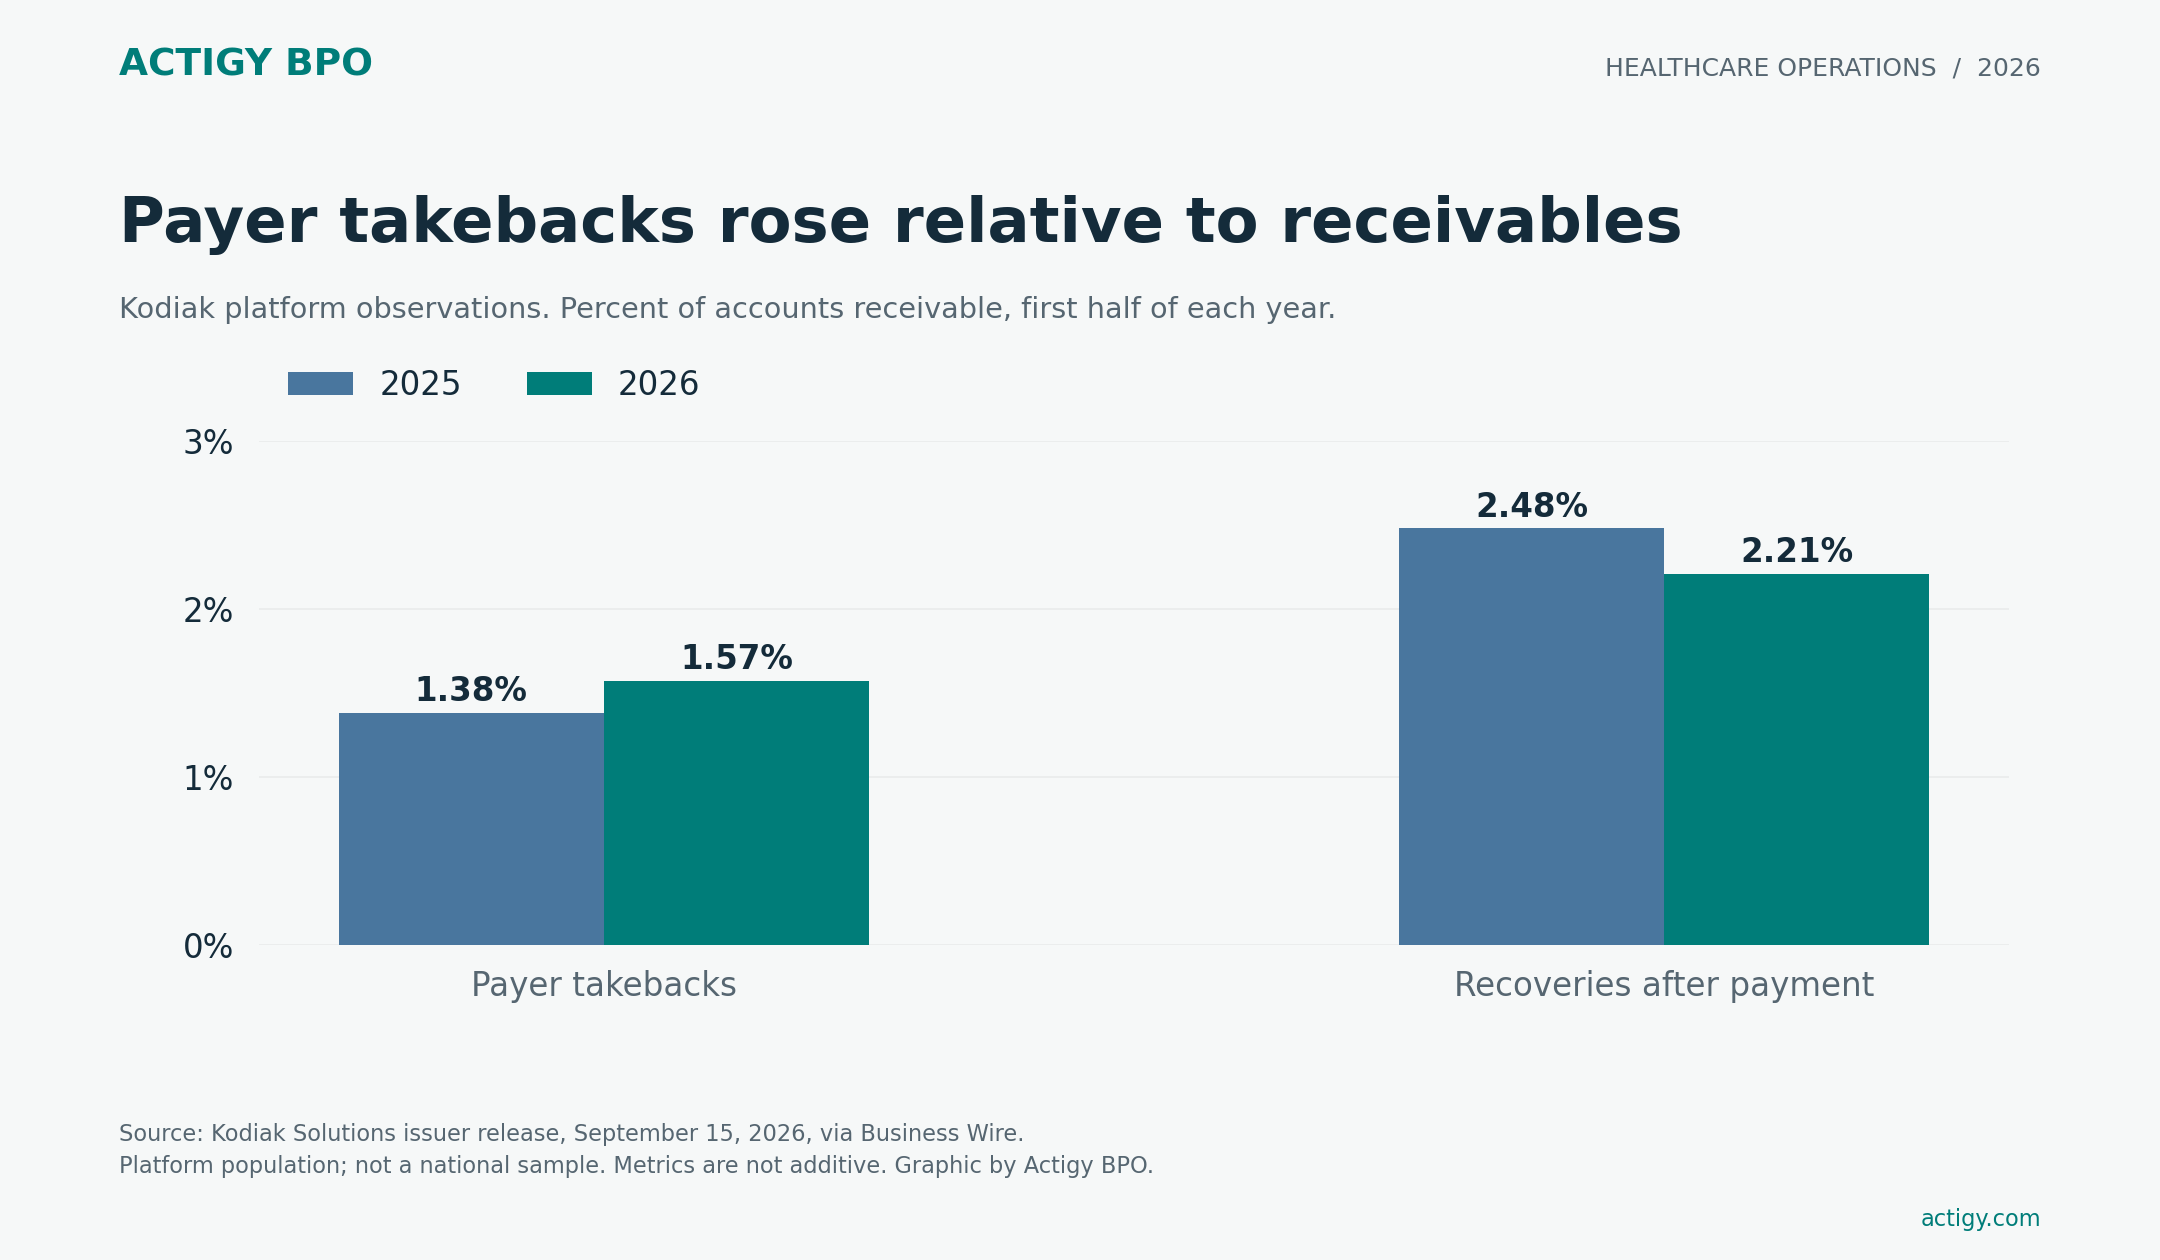
Source: Kodiak Solutions. Both rows use the accounts-receivable denominator reported in the issuer release. The measures do not represent shares of claim counts. Do not relabel them as percentages of net revenue. [5]
The management implication is to track payment durability alongside denial reduction. A closed appeal with a payment is a meaningful result. It is not a complete measure of retained cash if the payer can reopen or recoup the payment later. Give recoupment notices an owner and reconcile them with the original claim and cash record.
For context, Kodiak’s March 2026 release reported more than $48 billion in 2025 net revenue losses across its hospital platform from final denials and uncollected patient amounts combined. That total is not a national denial-only loss estimate. [6]
Why survey percentages are not claim denial rates
Experian Health’s January-February 2026 survey covered 200 healthcare leaders. Respondents identified missing or incomplete data at 63%, data inaccuracies at 62% and authorization issues at 59% as leading contributors to denials. These are shares of respondents selecting causes, with overlapping answers. They are not a breakdown of all denied claims. [7]
The same survey found that 24% of respondents said denial rates had increased over the previous 12 months. That finding is different from “24% of claims were denied.” Its reported rate bands placed 76% of respondents at 10% or less. A respondent distribution does not give a claim-volume-weighted national denial rate. [7]
Those distinctions change which intervention makes sense. Missing documentation calls for a readiness check and a named provider owner. Inaccurate fields call for validation against an approved source. An authorization issue requires inspection of the actual approval, dates and service limits. A generic instruction to resubmit faster does not resolve any of those causes on its own.
Keep the 2025 and 2026 Experian studies separate. The 2025 State of Claims study surveyed 250 professionals in a different field period. The issuer’s September 2025 release says 41% of providers reported denial rates of at least 10%. The 2026 study uses different rate bands and a different sample. These figures do not establish a matched year-on-year improvement. [8]
A denial metric dictionary for billing teams
Before comparing results, document what the team counts as a claim, denial, correction and resolution. Keep claim-level and line-level reporting separate. Store the original claim identifier so resubmissions do not silently inflate the denominator.
HFMA’s Claim Integrity Task Force defines initial denials, write-offs and time-to-resolution measures. Its published initial-denial method includes a denominator based on the average of the preceding three months of submissions. A same-cohort internal rate is a different method and should be labeled accordingly. [9]
| Metric | Recommended local definition | Control needed |
|---|---|---|
| Initial denial incidence | Unique original claims receiving a first denial divided by original claims in a defined, mature submission cohort | State the runout period and unresolved share |
| Denied charge share | Gross charges affected by initial denials divided by submitted gross charges for that cohort | Do not call gross charges recoverable cash |
| Appeal success | Appeals with a favorable final outcome divided by appeals with a final outcome | Exclude still-pending appeals from this denominator |
| Time to first action | Days from denial receipt to the first documented action | Distinguish automated touch from substantive action |
| Time to resolution | Days from initial denial to final disposition | Split paid, adjusted and unresolved outcomes |
| Rework cost | Attributable labor and allocated cost divided by cases actually worked | State whether cost uses paid or productive hours |
| Retained recovery | Collected cash less identified later recoupments for the tracked cohort | Publish the observation window |
The local definitions above are Actigy BPO’s proposed operating dictionary. They are not labeled as HFMA-certified measures. If your dashboard adopts an external definition, use its complete specification, including exclusions and timing, rather than borrowing only its name.
For a simple incidence example, 800 unique initial denials in a mature cohort of 10,000 original claims produce an 8% rate. Reworking 500 of those claims does not change the original incidence. It creates a separate worked-case rate. In a less developed cohort, show any claims still awaiting a decision rather than implying a fully developed result.
Similarly, clean claim rate and denial incidence should not automatically sum to 100%. They can refer to different stages and different denominators. Confirm whether clean means clearinghouse acceptance, payer acceptance or successful first-pass payment before using the metric in a performance claim.
What does a denied claim cost to rework?
Calculate the cost of your denial rework queue
Illustrative monthly labor model in USD. Enter aggregate counts only. Cost per paid hour and productive share are separate inputs; include each cost once. This model excludes recovered revenue.
The example yields $15,000 per month, $25 per worked case and $18.75 per denied claim. At zero claims, overhead can remain; unit costs are unavailable.
Premier’s 2025 release estimated $57.23 in administrative cost to contest a denied claim using 2023 hospital data, compared with $43.84 for 2022. Its voluntary survey represented 280 hospitals across 23 states. The $25.7 billion national cost estimate was an extrapolation. It should not be used as a universal current price for a physician practice. [4]
Actigy BPO’s denial rework model instead starts with a defined queue and your own labor assumptions. It separates the number of denials from the number actually worked, then records the time and cost of those cases. The model does not estimate recovered revenue from an industry appeal percentage.
| Input | Illustrative monthly value | Definition |
|---|---|---|
| Original claims in a mature cohort | 10,000 | Unique claims, excluding duplicate submissions |
| Initial denial incidence | 8% | Assumption for this example |
| Share of denied claims worked | 75% | Actual cases receiving rework |
| Active rework minutes per case | 30 | Total active time across all touches |
| Loaded cost per paid hour | $35 | Labor and employer costs |
| Productive share of paid time | 75% | Time available to work this queue |
| Other allocated costs | $1,000 | Costs not already included above |
Denied claims = original claims × denial incidence.
Worked cases = denied claims × worked share.
Active hours = worked cases × minutes per case ÷ 60.
Paid labor hours = active hours ÷ productive share.
Rework cost = paid labor hours × loaded hourly cost + other allocated costs.
The example generates 800 denied claims and 600 worked cases. Rework consumes 300 active hours, equivalent to 400 paid hours at a 75% productive share. Labor costs $14,000. With $1,000 overhead, the monthly rework cost is $15,000, or $25 per worked case. This is an illustrative calculation, not an observed Actigy BPO price or an industry benchmark.
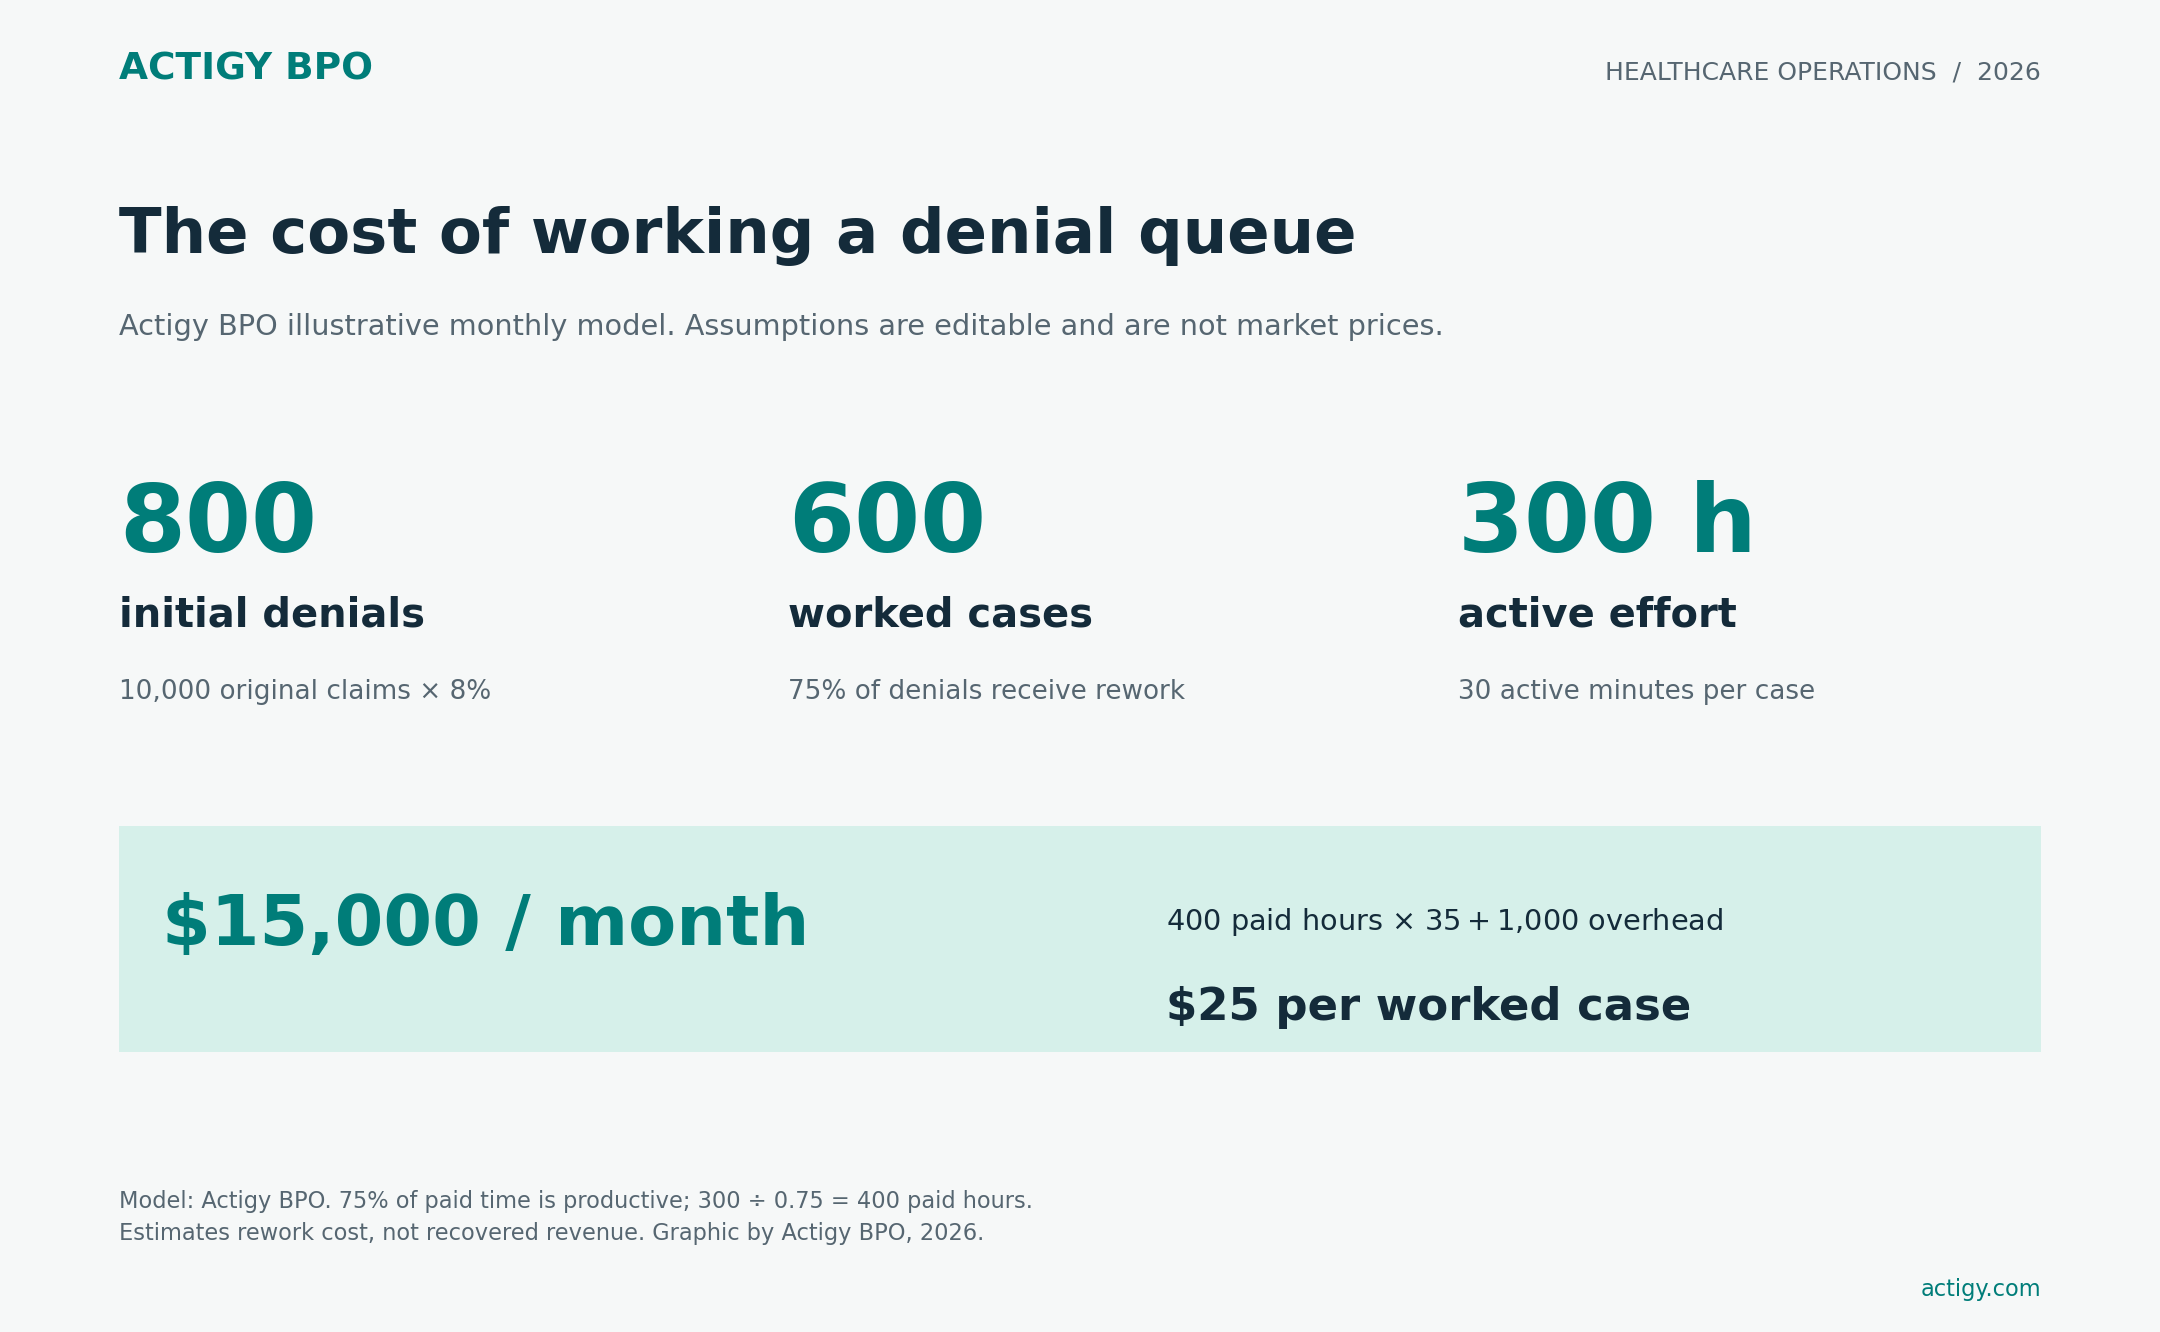
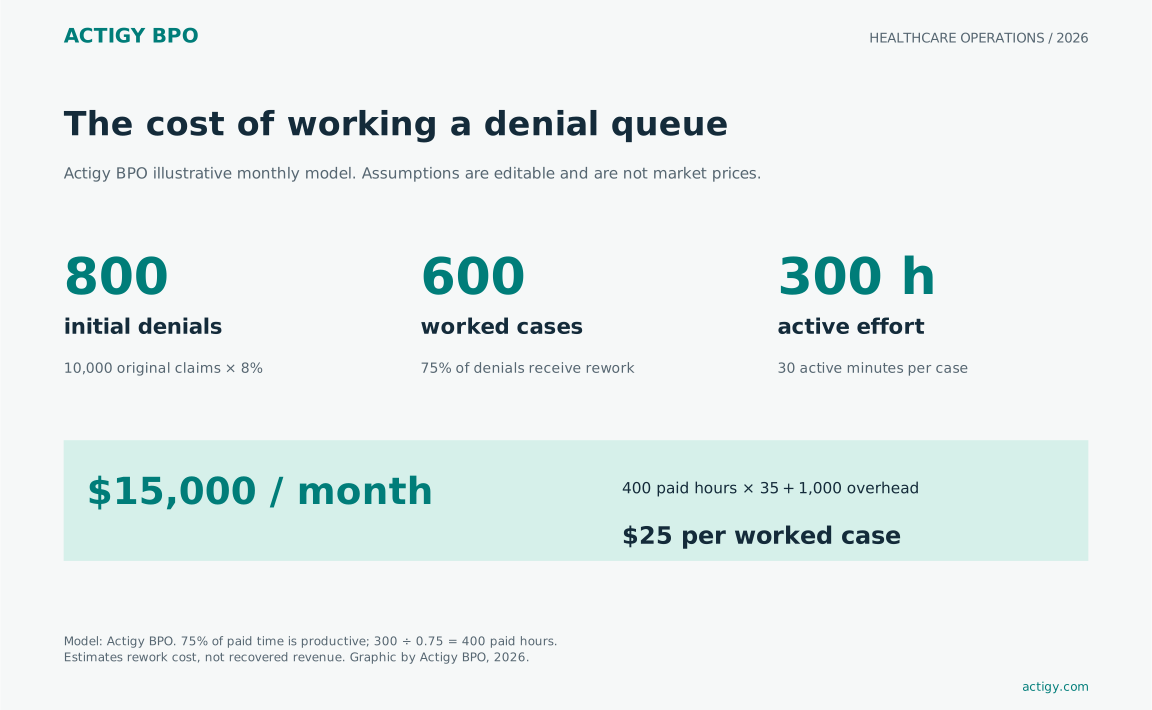
The cost allocated across all 800 denied claims would be $18.75 each. That is a different denominator and should never be displayed as the cost per worked case. Use the worked-case denominator when comparing two rework operating models with similar scope.
If initial denial incidence falls from 8% to 6%, while the other assumptions stay fixed, worked cases fall from 600 to 450 and active hours fall from 300 to 225. The model releases 75 active hours, or 100 paid-hour equivalents. Labor capacity is worth $3,500 at the assumed rate. Cash spending falls only if that capacity can be removed or avoids incremental spend. Otherwise it can be redeployed.
How sensitive is the rework budget?
Keep the 10,000-claim cohort, 75% worked share, 30 active minutes per worked case, $35 per paid hour, 75% productive share and $1,000 overhead constant. Changing the initial denial incidence produces the following scenario results.
| Initial denial incidence | Denied claims | Worked cases | Active hours | Monthly rework cost |
|---|---|---|---|---|
| 6% | 600 | 450 | 225 | $11,500 |
| 8% | 800 | 600 | 300 | $15,000 |
| 10% | 1,000 | 750 | 375 | $18,500 |
| 12% | 1,200 | 900 | 450 | $22,000 |
These are scenarios, not forecasts. They hold case mix and handling time constant. A small number of complex clinical disputes can consume more time than a larger group of simple data corrections. Separate those work types before comparing teams or vendors.
Revenue at risk requires a separate model based on expected allowed amounts, collectible balances, payer rules and evidence quality. Gross billed charges are not a suitable shortcut for expected cash. Keep recovered cash, written-off balances and unresolved balances in separate fields.
Build a denial prevention loop
Actigy BPO’s recommended review starts with the payer response and supporting evidence. A reason code helps route the work, but the complete remittance, contract, records and deadline determine the next action. Avoid labeling a code as universally recoverable.
| Queue pattern | Administrative response | Root-cause owner |
|---|---|---|
| Coverage dates or member data conflict | Check approved eligibility evidence and correct verified fields | Registration or eligibility team |
| Authorization missing or mismatched | Compare reference, dates, units and service information | Authorization team and provider reviewer |
| Coding or record issue | Assemble evidence and route the question | Provider and authorized coding reviewer |
| Additional information requested | Track the requested record, supplier and deadline | Named record owner |
| Post-payment recoupment | Reconcile original payment and notice, then route the dispute | Finance and payer-contract owner |
Use insurance eligibility verification to address repeated front-end coverage errors. Use prior authorization support for administrative authorization records. Aged unpaid balances that do not yet have a denial need AR follow-up, not an invented denial category.
For each repeat cause, record the fix, approving owner and implementation date. Review later claims for the same cause. A recovered claim demonstrates a collection result. Prevention requires evidence that comparable new claims encounter the problem less often.
Use the Actigy BPO medical billing process checklist to trace a recurring denial back to registration, documentation, coding or submission. The RCM guide connects those fixes to receivables and retained cash.
Where Actigy BPO fits in a denial program
For a baseline-versus-target comparison that also accounts for expected reimbursement left uncollected after follow-up, use the separate Actigy BPO denial cost calculator. Keep that reimbursement estimate separate from the staff rework budget calculated in this guide.
Actigy BPO provides denial management services covering scoped triage, corrections, appeal preparation, payer follow-up and root-cause reporting. A process audit and paid pilot establish the queue and quality controls. The client retains clinical decisions, coding policy, payer-contract interpretation and write-off authority. [10]
The service is relevant when a practice or billing company has a recurring, documented queue and can provide approved access and a review owner. Fit weakens when payer or client contracts prevent the proposed access, or when unresolved clinical evidence is the main constraint. Scope the specific work before choosing a staffing model.
In its anonymized telehealth RCM case study, Actigy BPO reports clean claim rate increasing from 84.1% to 97.8%, a 13.7 percentage-point increase. The engagement combined eligibility, coding support, billing, denials and AR. The results are company-reported and not independently audited. They do not establish the isolated effect of denial support or a universal performance promise. [11]
Scope a denial management pilot with Actigy BPO. Bring aggregate payer mix, claim age, recurring reasons and current rework effort. Use the service scope to agree a paid pilot. Agree the measurement definitions before comparing recovered cash, quality and turnaround.
Questions billing leaders ask
What is a good claim denial rate?
A useful target uses the same population and definition as the measured rate. MGMA’s public practice benchmark provides context, but the target for a particular organization should reflect its own payer mix, service mix and baseline. Avoid using a hospital-platform rate to judge a small physician practice without checking the differences.
Are prior authorization denials included?
Not in every dataset. Prior authorization concerns a proposed service, while the KFF Marketplace claims analysis used here concerns post-service claims. Read Actigy BPO’s prior authorization statistics guide for that separate workflow. The two rates should not be merged.
Does a lower denial rate prove more revenue?
No. Collection timing, allowed amounts, final adjustments and later recoupments can change the result. Track retained cash for a defined cohort and observation window alongside denial incidence and labor effort.
Can the calculator forecast recoveries?
The rework calculator estimates labor and allocated cost. Recovery forecasts need claim-specific collectible balances and evidence-based assumptions about outcomes. The example deliberately does not apply a national appeal percentage to your queue.
Which denial benchmark should a billing company use?
Segment results by client and payer before presenting a portfolio average. A change in client mix can move the average even when every team performs the same. Publish both the aggregate and sufficiently sized segments, with consistent rules for duplicates, pending cases and matured cohorts.
Related Actigy BPO guides
Estimate upstream authorization workload
Test AI in a defined billing queue
Download the Actigy BPO working files
Download the source observations CSV
Download the model assumptions JSON
Download the observation data and the source register. The accompanying calculation model is documented in the article.
Methodology and reuse
Actigy BPO reviewed accessible original research, public association guidance and issuer releases through October 18, 2026. This report is a public-source synthesis. The benchmark selection rule, local metric dictionary and rework model are Actigy BPO editorial contributions. They are not a proprietary national survey or audited client dataset.
The September 2026 issuer release states the direction of initial and final denial changes without giving an exact first-half-2026 initial denial percentage. This guide therefore reports the verified takeback and recovery measures. Specialty-level rates require separately defined data.
Download the accompanying data register for measurement periods, populations and source URLs. Reuse the original Actigy BPO charts and model with attribution, while respecting the underlying publishers’ rights. Suggested credit: “Actigy BPO, Medical Claim Denial Statistics 2026, synthesis of named sources and illustrative rework model, checked October 18, 2026.” Link to this report and retain the dataset notes.
Sources and data notes
1. MGMA: Days in AR holds steady for most practices but payer pressure persists in 2026. Release: 2026-07-30. Measurement: Benchmark summary across the preceding four years. Public MGMA benchmark commentary. Detailed benchmark sample is not supplied in the quoted passage. Do not treat the article poll sample as the denial benchmark sample.
2. KFF: Claims denials and appeals in ACA Marketplace plans in 2024. Release: 2026-03-24. Measurement: 2024 post-service claims. CMS transparency data for HealthCare.gov QHPs. Medical and prescription drug claims after service. Does not cover all insurance or prior authorization requests.
3. Kodiak Solutions: Initial denials continued to rise in 2024. Release: 2025-05-21. Measurement: 2024. Issuer release, more than 2,100 hospitals and 300,000 practice-based physicians. Historical initial claim denial observation, not a 2026 national rate.
4. Premier: Claims adjudication costs providers 25.7 billion dollars. Release: 2025-02-24. Measurement: 2023 claims; survey fielded August 2024 to February 2025. Voluntary member survey representing 280 hospitals across 23 states. Estimates weighted by acute bed capacity. National cost is an extrapolation, not observed total spending.
5. Kodiak Solutions: Falling claim denial rates fail to drive better financial performance. Release: 2026-09-15. Measurement: First half 2025 compared with first half 2026. Issuer release about proprietary platform analysis covering more than 2,300 hospitals and 375,000 physicians. Takeback and recovery figures use accounts receivable as denominator. Not a representative national sample.
6. Kodiak Solutions: Net revenue losses from final denials and bad debt grew in 2025. Release: 2026-03-31. Measurement: 2024 compared with 2025. Platform-based provider analysis. More than $48 billion includes final denials AND uncollected patient amounts. Never label this as denial-only national loss.
7. Experian Health: Claims denial management survey a front end data quality story. Release: 2026. Measurement: January to February 2026. Survey of 200 healthcare leaders. Cause percentages are respondents identifying causes, not shares of denied claims. Responses may overlap.
8. Experian Health: 2025 State of Claims survey release. Release: 2025-09-22. Measurement: June to July 2025. Survey of 250 healthcare professionals. Different sample and rate bands from the 2026 front-end survey; not a matched longitudinal panel.
9. HFMA: Standardizing denial metrics for revenue cycle benchmarking and process improvement. Release: Publication date not stated. Measurement: Metric definitions. Claim Integrity Task Force guidance. Contains sponsor disclosures. Defines metrics; does not establish a universal target denial rate.
10. Actigy BPO: Denial management services. Release: 2026-10-04. Measurement: Current service scope. Company service description, not independent performance evidence.
11. Actigy BPO: Telehealth RCM case study. Release: 2026-10-04 update. Measurement: Engagement period not specified. Anonymized company-reported combined engagement. Not independently audited. Clean-claim result cannot be attributed to denial work alone.