Prior Authorization Statistics 2026 and the Cost of Administrative Work
Published · Last updated
Prior authorization creates three distinct operating demands: request volume, handling time and payer decisions. Actigy BPO’s statistics guide connects current research with a workload calculator so practices and billing companies can estimate administrative capacity without treating a survey average as a staffing rule.
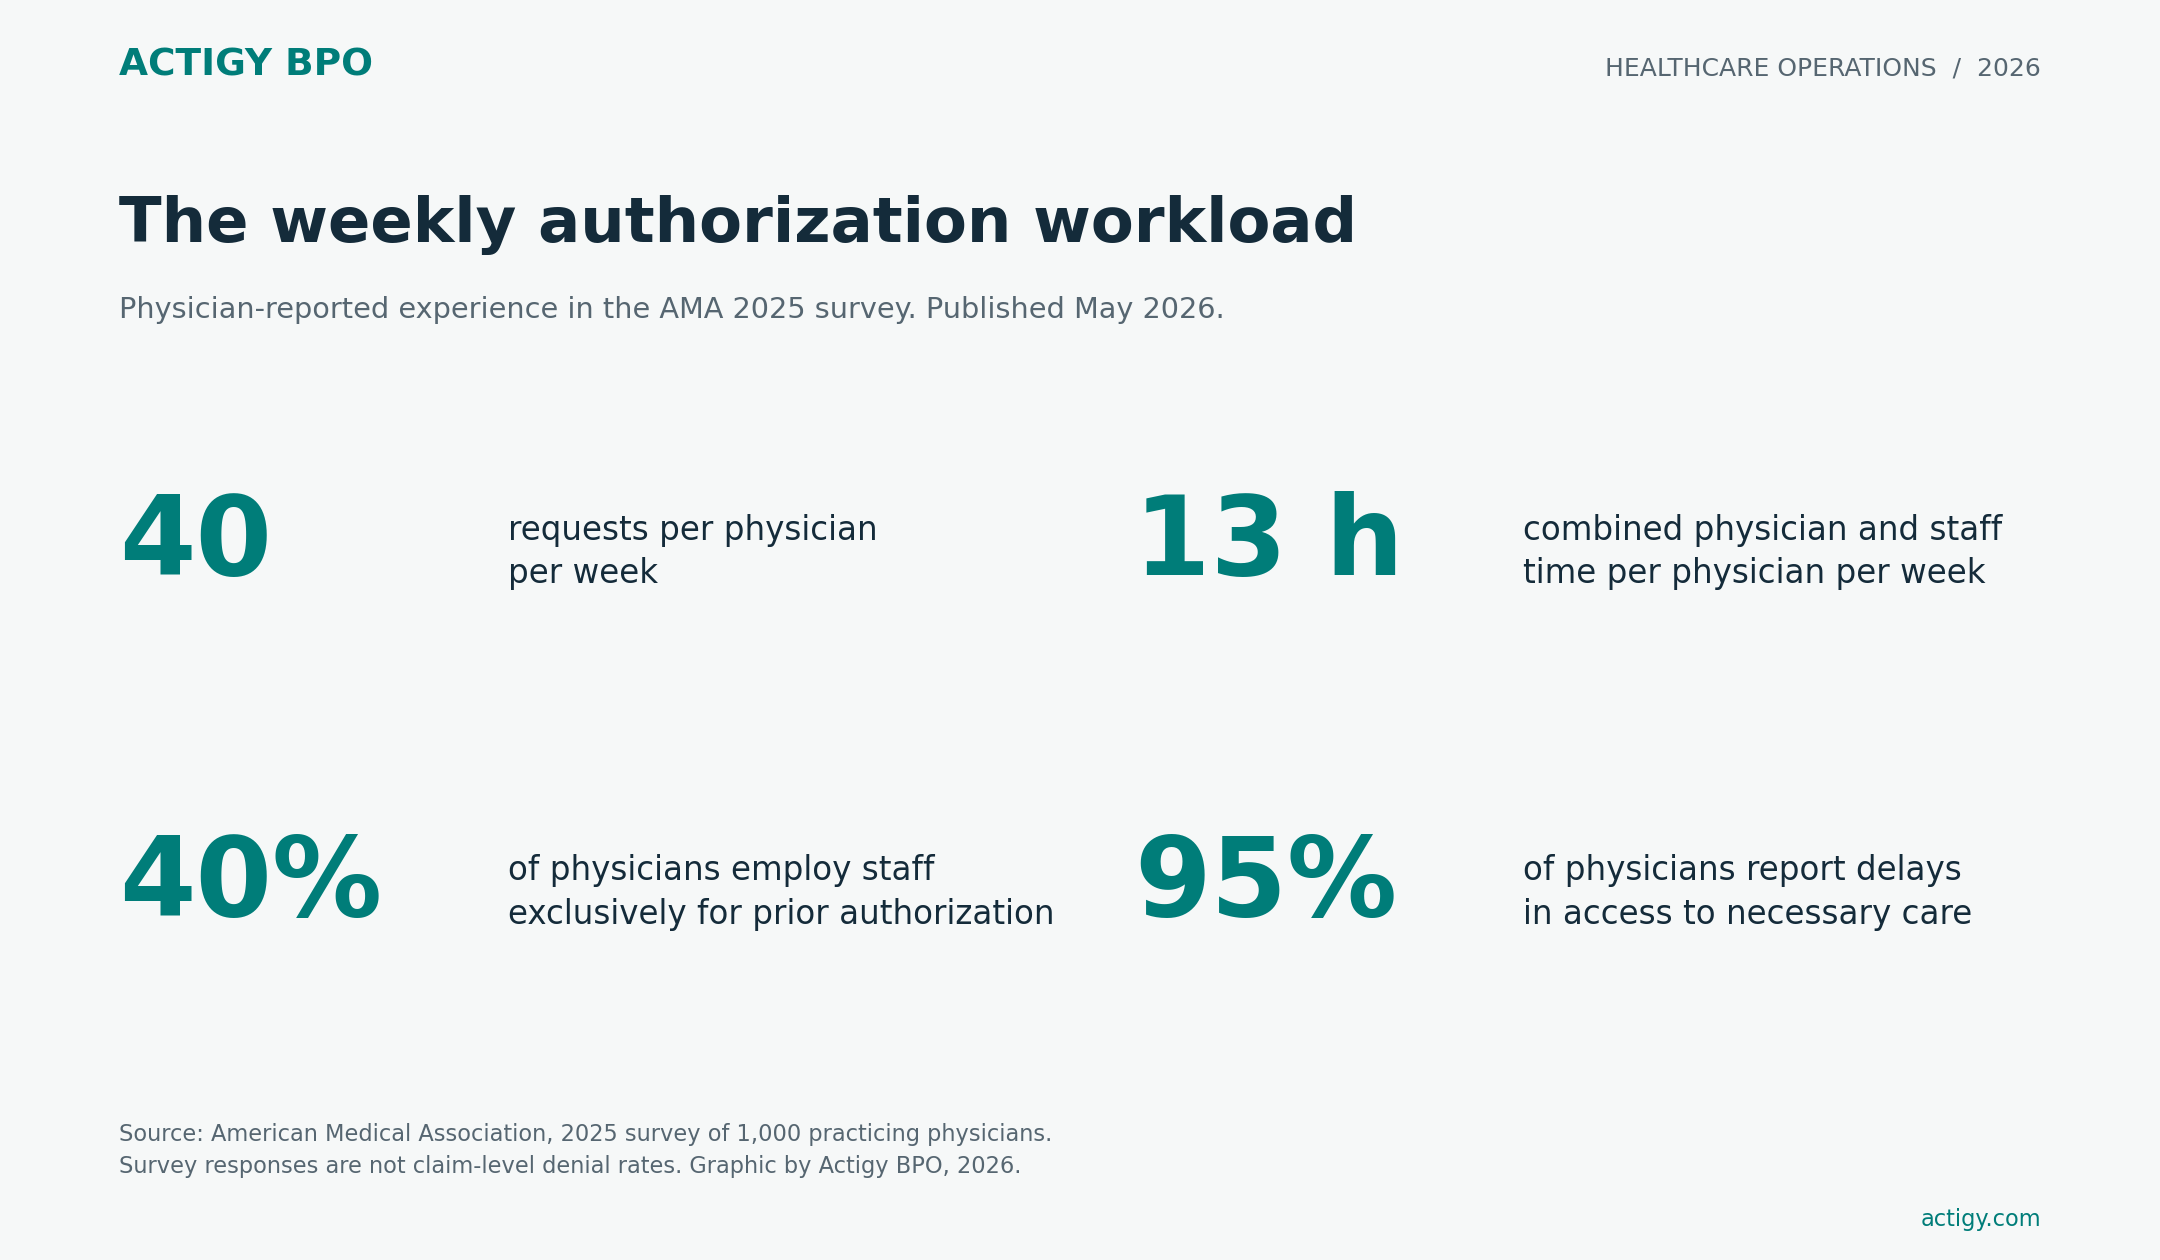
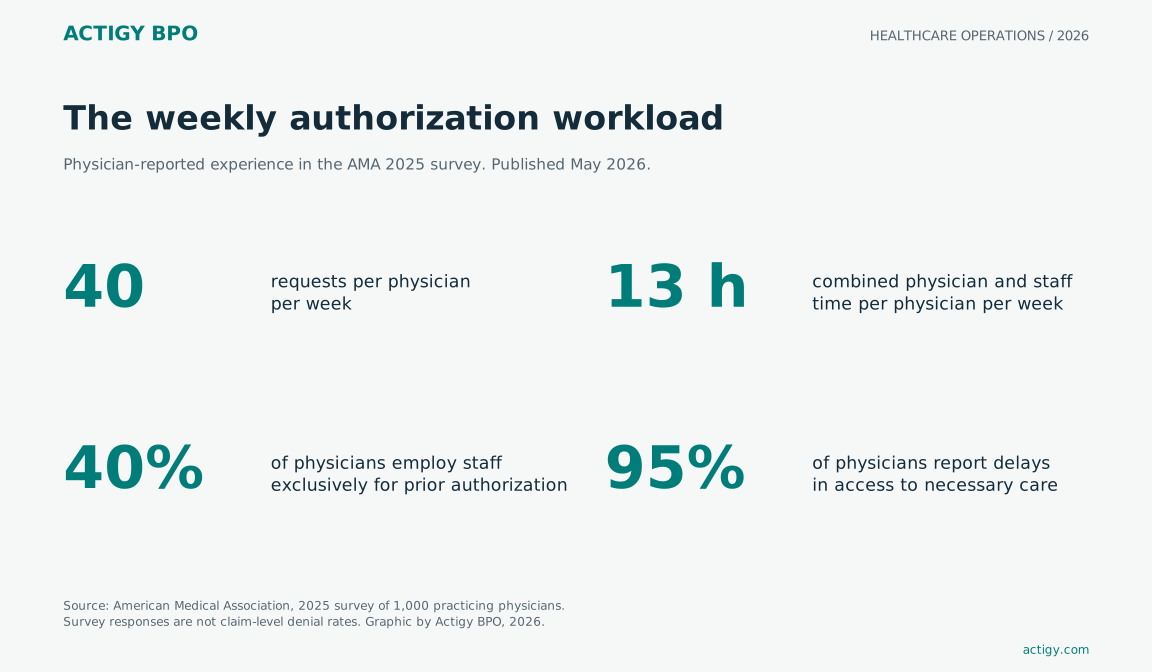
In the AMA’s 2025 survey, physicians reported 40 prior authorizations and 13 hours of combined physician and staff work per physician each week. Those are survey averages, not a staffing standard. Actigy BPO’s contribution is the source map, comparison rules and adjustable cost model below. [1]
Download the Actigy BPO Prior Authorization Queue Scorecard. Editable Word file. No registration is required.
What the latest evidence measures
The 2026 edition uses the latest accessible evidence checked for this release. A publication date and a measurement year are different fields. An analysis published in 2026 can describe care delivered in 2024. Every table states the relevant population so readers can decide whether a number applies to their own queue.
| Evidence | Finding | Measurement period and population |
|---|---|---|
| AMA workload | 40 requests and 13 combined staff and physician hours per physician per week | 2025 survey of 1,000 practicing physicians |
| AMA dedicated staff | 40% employ staff exclusively for prior authorization | Physician respondents, 2025 |
| AMA delays | 95% report delays in access to necessary care | Physician respondents, 2025 |
| KFF request volume | 52.8 million determinations | Medicare Advantage, 2024 |
| KFF denials | 7.7% denied fully or partly | Medicare Advantage determinations, 2024 |
| KFF appeals | 11.5% of denied requests appealed | Medicare Advantage, 2024 |
| KFF appeal outcomes | 80.7% of appeals fully or partly overturned | Selected appealed requests, 2024 |
| KFF patient experience | 69% describe prior authorization as a burden | Insured adults, January 2026 poll |
Sources: [1], [2], [3]. An appeal overturn rate describes appealed cases. It does not establish that the same share of every denied request would succeed on appeal.
KFF’s patient poll also found that 39% of insured adults with a chronic condition named prior authorization as their single biggest burden beyond cost. That perspective belongs beside the staffing numbers. A queue can look efficient while patients still struggle to understand who is handling a request. [3]
For a practice manager, the immediate question is which work is waiting and why. Missing documentation requires a provider response. An accepted submission awaiting a payer decision requires status monitoring. A clinical question requires a qualified reviewer. Reporting all three as an undifferentiated backlog hides the action needed to move each case.
Prior authorization denial rates by insurance market
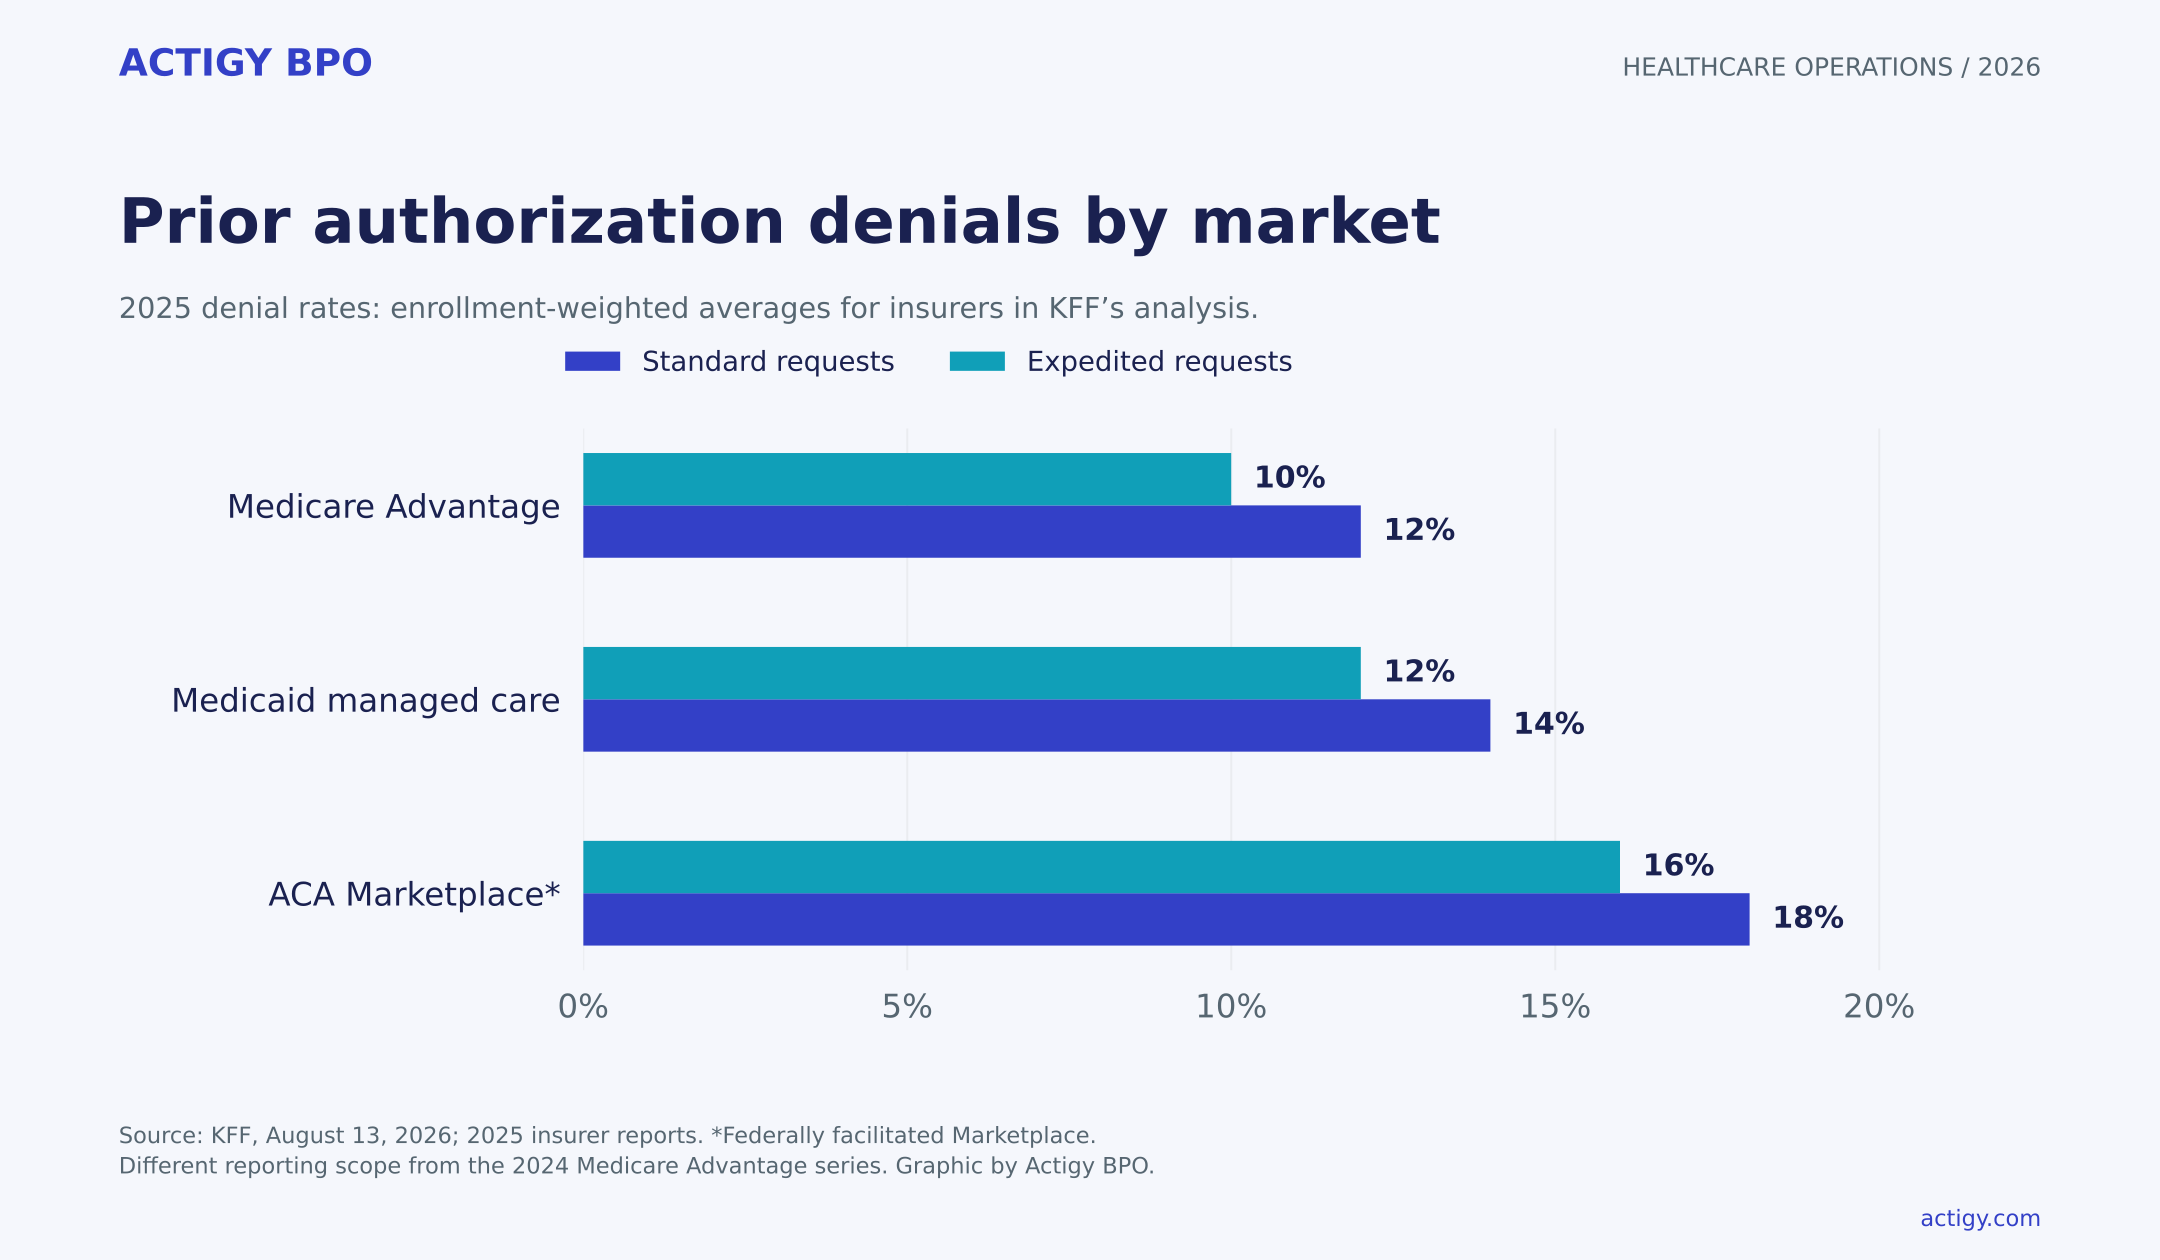
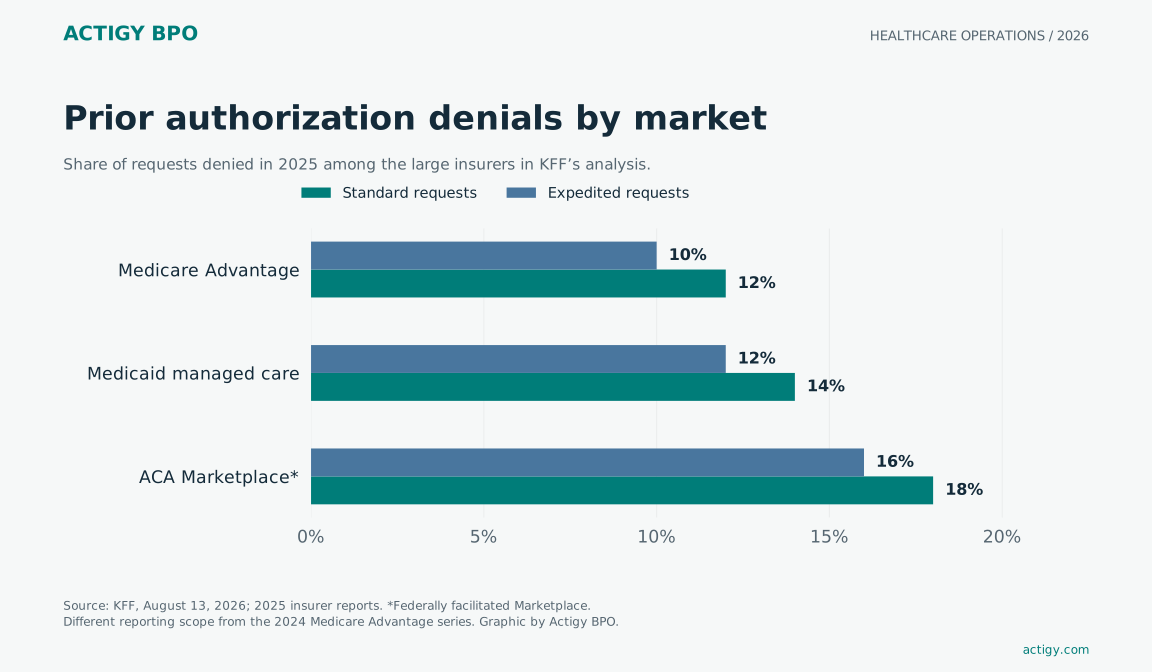
KFF’s August 2026 analysis examined public 2025 reports from 14 large insurers across Medicare Advantage, Medicaid managed care and the federally facilitated ACA Marketplace. Its findings provide a more recent market comparison, but they use a different collection method and insurer scope from the 2024 Medicare Advantage series. [4]
| Insurance market | Standard requests denied | Expedited requests denied |
|---|---|---|
| Medicare Advantage | 12% | 10% |
| Medicaid managed care | 14% | 12% |
| ACA Marketplace on the federal platform | 18% | 16% |
Source: KFF analysis of public insurer reports for 2025. These are enrollment-weighted market averages for the included insurers, not Actigy BPO client results or a forecast for an individual practice. [4]
Included insurers and enrollment-weighted market averages; not a trend from the 2024 Medicare Advantage series. Source: KFF, August 2026. Graphic by Actigy BPO.
When assessing your own denial rate, split results by payer, service group, urgency and submission channel. Keep requests awaiting a decision out of the decided-request denominator. Keep withdrawn and duplicate requests visible as separate statuses. Publish the chosen exclusions with the result.
An authorization is also distinct from payment of a later claim. Eligibility confirms reported coverage, authorization records a payer determination for a proposed service, and billing tests a claim after delivery. The operational handoff should carry the authorization reference, approved dates, units and relevant conditions into the medical billing workflow.
How to calculate prior authorization cost
Estimate prior authorization workload and cost
Illustrative monthly capacity model in USD. Enter aggregate operational assumptions only. Workload FTE is not a staffing recommendation or a prediction of payer decisions.
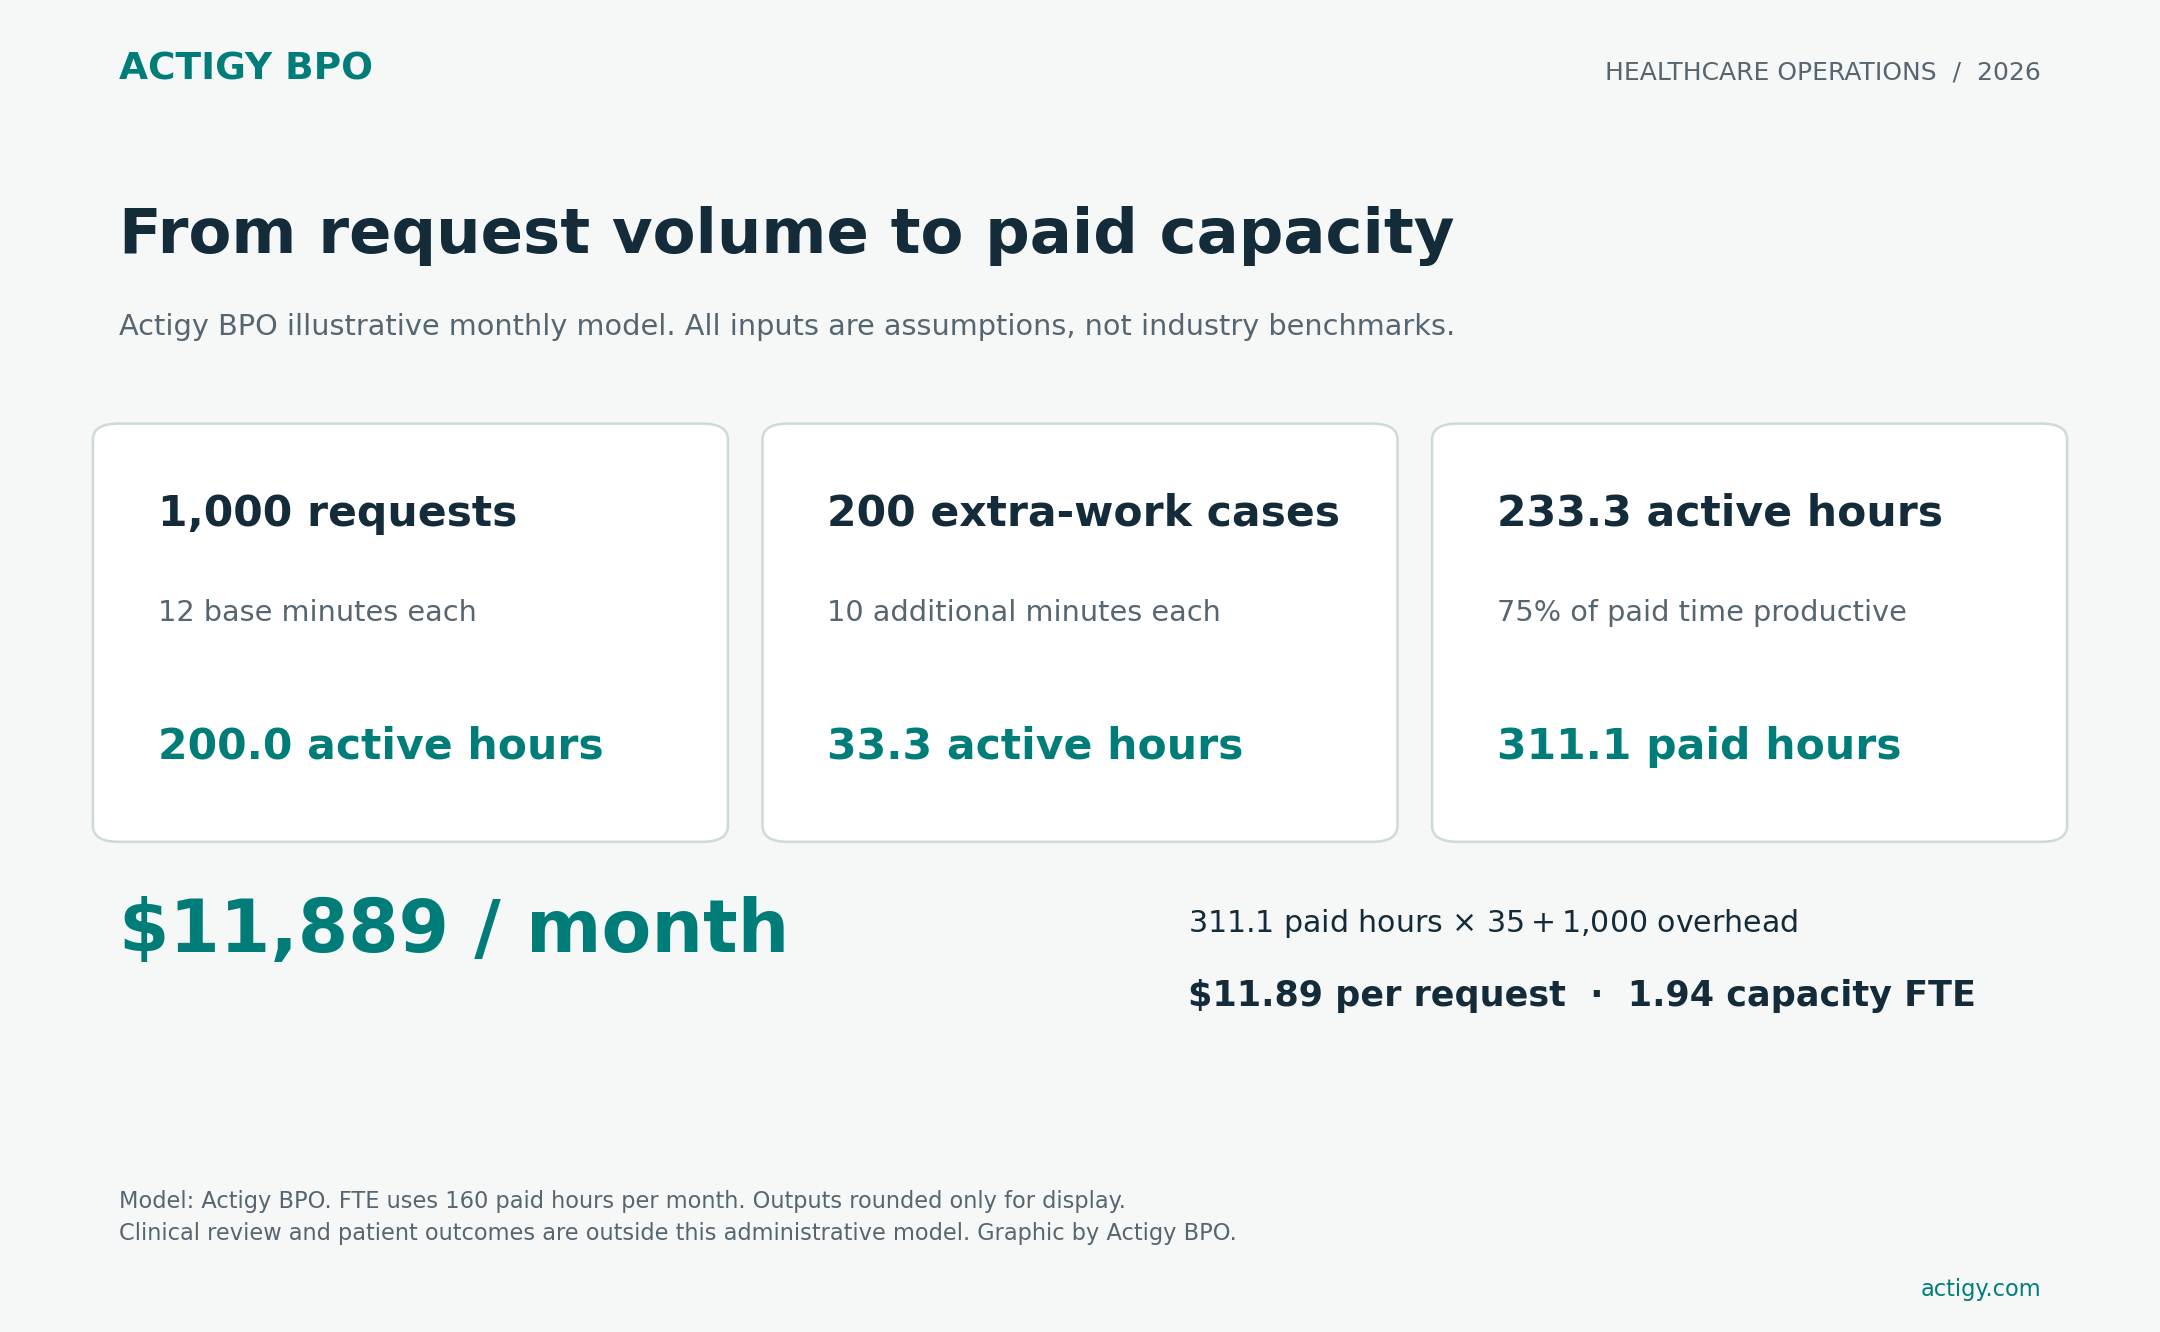
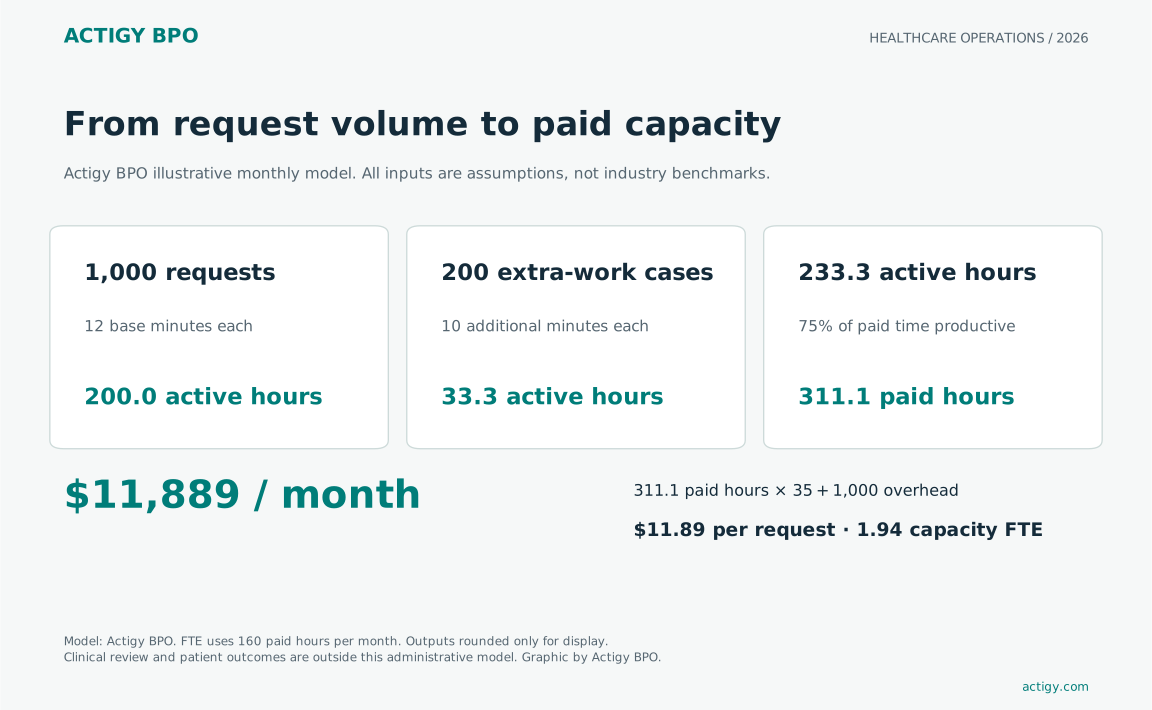
The example yields 233.33 active hours, 311.11 paid hours, 1.94 workload FTE and $11,888.89 per month. If base handling already includes follow-up, set extra work to zero.
Actigy BPO’s workload model estimates administrative labor from the work a team actually handles. It separates first handling, additional work and overhead. It does not predict payer approval, clinical time or a guaranteed outsourcing saving.
Use a representative sample of recently completed requests. Record active handling minutes separately from elapsed waiting time. Include approved calls, document checks and status updates. If a request receives several extra touches, add their minutes together. Do not enter the entire elapsed time between submission and decision as staff labor.
The calculator uses these inputs:
| Input | Meaning | Illustrative monthly value |
|---|---|---|
| Requests | New administrative requests handled | 1,000 |
| Base handling time | Active minutes for the first handling cycle | 12 minutes |
| Extra-work share | Requests needing additional administrative work | 20% |
| Extra-work time | Total additional active minutes per affected request | 10 minutes |
| Loaded labor cost | Wage and employer costs per paid hour | $35 |
| Other allocated costs | Software and overhead not included in labor | $1,000 |
| Paid hours per FTE | Monthly paid time for one full-time equivalent | 160 hours |
| Productive share | Paid time available for this queue | 75% |
All figures in this example are assumptions. Replace them with your own records. A practice whose base-handling measure already includes follow-up should set the additional-work term to zero to avoid double counting.
Base hours = requests × base minutes ÷ 60.
Additional hours = requests × extra-work share × additional minutes ÷ 60.
Total active hours = base hours + additional hours.
Capacity FTE = total active hours ÷ (paid hours per FTE × productive share).
Because the labor input is a cost per paid hour, paid labor hours = total active hours ÷ productive share. Monthly administrative cost = paid labor hours × loaded hourly cost + other allocated costs. Cost per request = monthly administrative cost ÷ requests.
For the example above, base work requires 200 active hours and additional work requires 33.3 hours. At a 75% productive share, the model requires 311.1 paid hours, or 1.94 capacity FTE. Paid labor costs $10,889. Adding $1,000 of overhead gives $11,889 per month, or $11.89 per request.
A fractional FTE is a capacity estimate. It is not a roster or a quote. Coverage, leave, payer-call windows and access to clinical reviewers can require a different staffing arrangement. The model also excludes patient harm, lost appointments and forgone revenue because these require separate evidence and should not be invented from an authorization percentage.
Which assumptions change the budget most?
The following scenarios keep 1,000 requests, $35 per paid hour, 160 paid hours per FTE, a 75% productive share and $1,000 overhead constant. Extra-work time stays at 10 minutes per affected request.
| Scenario | Base minutes | Extra-work share | Active hours | Capacity FTE | Monthly cost |
|---|---|---|---|---|---|
| Lower effort | 8 | 10% | 150.0 | 1.25 | $8,000 |
| Working example | 12 | 20% | 233.3 | 1.94 | $11,889 |
| Higher effort | 18 | 30% | 350.0 | 2.92 | $17,333 |
These are modeled scenarios, not measured industry percentiles. Their purpose is to show why a per-request price means little without a definition of the work. The same request volume can create more than twice the active workload when handling time and repeat touches increase.
Before adding staff, identify the stage that consumes the extra time. If information arrives incomplete, improve intake and insurance eligibility verification. If completed requests wait for follow-up, adjust queue ownership and contact schedules. If clinical evidence is the constraint, additional administrative capacity alone will not resolve it.
What changed under the CMS rule
CMS-0057-F introduced operational provisions generally beginning in 2026, with API requirements generally beginning in 2027. The official fact sheet sets 72-hour expedited and seven-calendar-day standard decision timeframes for impacted payers, excluding Qualified Health Plan issuers on federally facilitated exchanges from that timeframe provision. The cited provisions exclude drugs. Initial public metrics were due March 31, 2026. [5]
CMS’s implementation page, updated October 8, 2026, continues to distinguish the operational and API timelines. Match the payer and product to the applicable provision before building a deadline rule. Separate proposed changes from final requirements. [6]
For an operations team, the practical response is a maintained payer-rule register. Record the source, product, effective date and owner for each rule used by the queue. Route uncertainty to the client’s authorized reviewer. A generic seven-day countdown applied to every request can create false assurances and incorrect escalation.
Automation can reduce repeated entry and make statuses easier to retrieve. It still needs reliable inputs and a documented handoff when a payer asks for more information. An API connection does not establish that clinical documentation is complete or that a service will be paid.
The Actigy BPO authorization queue scorecard
Actigy BPO recommends reviewing administrative control and payer outcomes separately. The scorecard below is an editorial operating framework, not a validated industry index. It gives every unresolved request an actionable status without assigning an unsupported numerical score.
| Review area | Record to keep | Management question |
|---|---|---|
| Readiness | Required fields, missing evidence, assigned owner | Can this request be submitted accurately? |
| Submission | Time, channel and payer receipt or reference | Can we prove what was submitted? |
| Pending work | Last response, next action and follow-up date | Is someone responsible for moving this case? |
| Clinical handoff | Question, receiving reviewer and acknowledgement | Is the clinical issue with the right person? |
| Determination | Actual decision, dates, units and conditions | Can scheduling and billing use the result? |
| Administrative effort | Active minutes and extra touches by cause | What is consuming the team’s capacity? |
Run the scorecard on a defined sample before setting service levels. The acceptable time to first administrative action is not the same as time to payer determination. Measure both. Track median and slower-tail completion times so a small group of stuck requests does not disappear inside an average.
For a daily queue review, show unresolved cases by owner and age, upcoming service dates and missing inputs. Clinical urgency and patient communication remain under the provider’s policies. Aggregate statistics should help identify work, not override an individual patient’s needs.
Where Actigy BPO fits
To test the request, receipt, response and next-action workflow against the CMS implementation scope, use the Actigy BPO 2027 readiness checklist. Its evidence checks complement the workload estimate here.
Actigy BPO provides prior authorization administrative support for practices, clinics and billing companies. A written scope can include intake, document collection, approved submissions, payer follow-up and status records. Providers retain clinical judgments and payers make authorization decisions. [7]
The strongest fit is a recurring, documented queue with approved system access, known payer channels and a named clinical escalation owner. A multi-practice billing company also needs clear client-level permissions and separate records. A backlog with missing medical evidence needs a provider response before extra administrative capacity can help.
For work spanning eligibility, submission and unpaid balances, review Actigy BPO’s revenue cycle management outsourcing. Keep the authorization workload visible even when the team covers more of the revenue cycle.
Scope a prior authorization pilot with Actigy BPO. Bring monthly request volume, payer mix, active handling time and required coverage. Use aggregate figures only. Agree the service scope before starting a paid pilot. The pilot should test documentation, follow-up and escalation quality against agreed measures.
Questions practices ask about the data
What is the average prior authorization denial rate?
There is no single rate for every US payer and service. Choose a source that matches the insurance market, request type and period. Actigy BPO’s comparison table separates those fields and should be read with its source notes. Do not substitute a physician’s report that requests are often denied for a measured share of requests denied.
How many staff does prior authorization require?
Estimate active handling and additional work first, then divide by productive hours per FTE. The example in this guide requires 1.94 capacity FTE for 1,000 monthly requests under its stated assumptions. Actual staffing must also cover schedules, absence and escalation needs. It is not a universal requests-per-person benchmark.
Is prior authorization approval a payment guarantee?
No. Keep eligibility, authorization and post-service claims as separate workflow stages. Record the payer’s stated conditions and pass them into billing. If a later claim is denied, it belongs in a claim denial review process with its own evidence and deadlines.
Can an administrative team handle clinical appeals?
Administrative staff can assemble authorized records and track an approved handoff. Clinical reasoning, medical necessity and peer-to-peer review need the provider’s qualified reviewer. The written scope must state who prepares, approves and submits each part of a response.
Why does the report use older measurement years?
National data are released after collection and validation. A current report can therefore use earlier measurement periods. This edition labels the data year beside each result and keeps different reporting systems out of a single trend line.
Related Actigy BPO guides
Measure claim denial rates and rework
Download the Actigy BPO working files
Download the source observations CSV
Download the model assumptions JSON
Methodology and reuse
Actigy BPO reviewed accessible primary publications and issuer research releases through October 18, 2026. This is a synthesis of public evidence, not an Actigy BPO patient study. The workload model and scorecard are Actigy BPO editorial tools. Their assumptions are explicitly separated from observed data.
Physician surveys, insurer rates and administrative cost models answer different questions. Comparable cost per completed authorization across practice types and consistent service-level turnaround distributions remain gaps in the public evidence.
The accompanying dataset gives each observation a source, period, population and limitation. Readers can reuse the original Actigy BPO charts and model with attribution. Underlying source publications retain their own rights. Suggested credit: “Actigy BPO, Prior Authorization Statistics 2026, synthesis of named sources and illustrative workload model, checked October 18, 2026.” Link to this guide and retain the original source notes.
For the downstream billing stage, use Actigy BPO’s companion medical claim denial statistics guide. It treats post-service denials and rework costs separately.
Sources and data notes
1. American Medical Association: 2025 Prior Authorization Physician Survey release. Release: 2026-05-13. Measurement: 2025 survey. Issuer press release. Survey of 1,000 practicing physicians. Self-reported experiences, not a claims audit.
2. KFF: Medicare Advantage insurers made nearly 53 million prior authorization determinations in 2024. Release: 2026. Measurement: 2024. Analysis of CMS contract-level reporting. Withdrawn or dismissed requests excluded. Appeal results concern selected appealed cases.
3. KFF: Prior authorizations rank as the public’s biggest burden when getting health care. Release: 2026-02-02. Measurement: 2026-01-13 to 2026-01-20. National adult poll. Reported percentages used here refer to insured adults or the stated chronic-condition subgroup.
4. KFF: Prior authorization metrics provide new insights into insurer practices but gaps remain. Release: 2026-08-13. Measurement: 2025. Analysis of public reports from 14 unique large insurers across three markets. About 71 million enrollees represented. Market averages are weighted by enrollment within each insurance market; request types are source-defined.
5. CMS: CMS Interoperability and Prior Authorization Final Rule CMS-0057-F fact sheet. Release: 2024-01-17. Measurement: Operational provisions generally 2026 and APIs generally 2027. Official rule summary. Payer-specific scope matters. Drugs excluded from the cited prior authorization provisions. FFE QHP issuers excluded from the stated decision-timeframe provision.
6. CMS: Current CMS-0057-F implementation page. Release: 2026-10-08 page update. Measurement: 2026 to 2027 implementation. Current official implementation page checked on 2026-10-18. Proposed rules are not treated as final requirements.
7. Actigy BPO: Prior authorization outsourcing. Release: 2026-10-13. Measurement: Current service scope. Company service description. Administrative tasks only; clinical authority retained by provider.
Download the observation data and the source register. The accompanying calculation model is documented in the article.